
Page 267 - Mansfield 2019 Operating Budget
P. 267
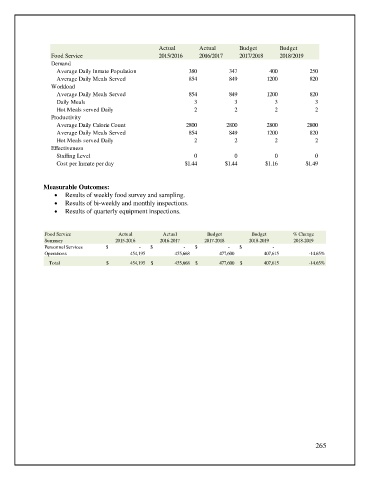
Actual       Actual       Budget        Budget
                  Food Service                        2015/2016    2016/2017    2017/2018     2018/2019
                  Demand
                    Average Daily Inmate Population            380           347          400          250
                    Average Daily Meals Served                 854           849         1200          820
                  Workload
                    Average Daily Meals Served                 854           849         1200          820
                    Daily Meals                                  3             3            3            3
                    Hot Meals served Daily                       2             2            2            2
                  Productivity
                    Average Daily Calorie Count                2800         2800         2800          2800
                    Average Daily Meals Served                 854           849         1200          820
                    Hot Meals served Daily                       2             2            2            2
                  Effectiveness
                    Staffing Level                               0             0            0            0
                    Cost per Inmate per day                   $1.44        $1.44         $1.16        $1.49


               Measurable Outcomes:
                   •  Results of weekly food survey and sampling.
                   •  Results of bi-weekly and monthly inspections.
                   •  Results of quarterly equipment inspections.


                Food Service            Actual         Actual         Budget        Budget        % Change
                Summary                2015-2016      2016-2017      2017-2018     2018-2019      2018-2019
                Personnel Services  $                              -  $                              -  $                            -    $                            -

                Operations                                454,195                        455,668                          477,600                        407,615  -14.65%


                 Total              $                    454,195  $                      455,668  $                    477,600  $                    407,615  -14.65%


                                                                                                         265