
Page 56 - FY 19 Budget Forecast 91218.xlsx
P. 56
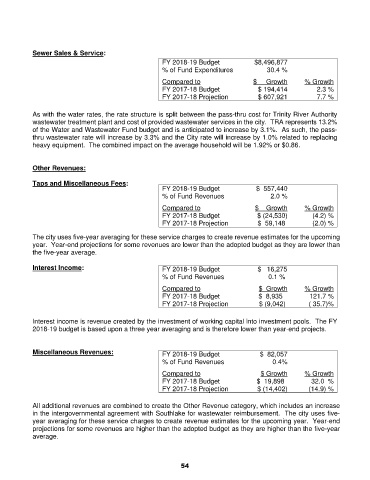
Sewer Sales & Service:
                                                       FY 2018-19 Budget               $8,496,877
                                                       % of Fund Expenditures            30.4 %

                                                       Compared to                   $     Growth     % Growth
                                                       FY 2017-18 Budget              $ 194,414           2.3 %
                                                       FY 2017-18 Projection          $ 607,921           7.7 %

            As with the water rates, the rate structure is split between the pass-thru cost for Trinity River Authority
            wastewater treatment plant and cost of provided wastewater services in the city.  TRA represents 13.2%
            of the Water and Wastewater Fund budget and is anticipated to increase by 3.1%.  As such, the pass-
            thru wastewater rate will increase by 3.3% and the City rate will increase by 1.0% related to replacing
            heavy equipment.  The combined impact on the average household will be 1.92% or $0.86.


            Other Revenues:

            Taps and Miscellaneous Fees:
                                                       FY 2018-19 Budget              $  557,440
                                                       % of Fund Revenues                  2.0 %
                                                       Compared to                   $    Growth      % Growth
                                                       FY 2017-18 Budget                 $ (24,530)            (4.2) %
                                                       FY 2017-18 Projection             $  59,148      (2.0) %

            The city uses five-year averaging for these service charges to create revenue estimates for the upcoming
            year.  Year-end projections for some revenues are lower than the adopted budget as they are lower than
            the five-year average.

            Interest Income:                           FY 2018-19 Budget                 $   16,275
                                                       % of Fund Revenues                 0.1 %

                                                       Compared to                     $  Growth      % Growth
                                                       FY 2017-18 Budget                 $  8,935        121.7 %
                                                       FY 2017-18 Projection              $ (9,042)          ( 35.7)%

            Interest income is revenue created by the investment of working capital into investment pools.  The FY
            2018-19 budget is based upon a three year averaging and is therefore lower than year-end projects.


            Miscellaneous Revenues:                    FY 2018-19 Budget               $  82,057
                                                       % of Fund Revenues                  0.4%

                                                       Compared to                     $ Growth       % Growth
                                                       FY 2017-18 Budget                $  19,898        32.0  %
                                                       FY 2017-18 Projection            $ (14,402)     (14.9) %

            All additional revenues are combined to create the Other Revenue category, which includes an increase
            in the intergovernmental agreement with Southlake for wastewater reimbursement.  The city uses five-
            year averaging for these service charges to create revenue estimates for the upcoming year.  Year-end
            projections for some revenues are higher than the adopted budget as they are higher than the five-year
            average.


                                                             54