
Page 36 - FY 19 Budget Forecast 91218.xlsx
P. 36
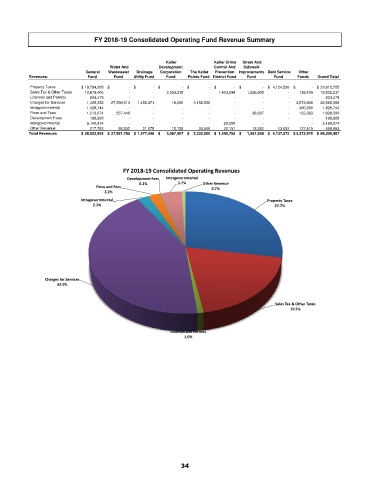
FY 2018-19 Consolidated Operating Fund Revenue Summary


                                                         Keller         Keller Crime    Street And
                                      Water And       Development       Control And   Sidewalk
                              General   Wastewater    Drainage   Corporation    The Keller   Prevention   Improvements   Debt Service    Other
           Revenues:          Fund     Fund   Utility Fund   Fund   Pointe Fund   District Fund   Fund   Fund   Funds   Grand Total

           Property Taxes   $   19,794,205  $                    -  $                  -  $                       -  $                     -  $                   -  $                       -  $    4,124,520  $                 -  $   23,918,725
           Sales Tax & Other Taxes       10,679,405                        -                      -            3,053,219                         -        1,403,598           1,526,609                        -         139,406       16,802,237
           Licenses and Permits            824,479                        -                      -                           -                         -                       -                           -                        -                      -            824,479
           Charges for Services         1,425,353       27,296,013       1,456,371                 16,000          3,198,500                       -                           -                        -      3,573,666       36,965,903
           Intragovernmental         1,428,744                        -                      -                           -                         -                       -                           -                        -         400,000         1,828,744
           Fines and Fees          1,213,074            557,440                      -                           -                         -                       -                36,607                        -         132,383         1,939,504
           Development Fees            198,928                        -                      -                           -                         -                       -                           -                        -                      -            198,928
           Intergovernmental         3,140,974                        -                      -                           -                         -             20,000                           -                        -                      -         3,160,974
           Other Revenue              217,762              98,332            21,075                 18,188               33,500             22,157                18,382              13,052         127,515            569,963
           Total Revenues   $   38,922,924  $   27,951,785  $   1,477,446  $        3,087,407  $      3,232,000  $    1,445,755  $       1,581,598  $    4,137,572  $ 4,372,970  $   86,209,457


                                          FY 2018‐19 Consolidated Operating Revenues
                                           Development Fees  Intergovernmental
                                               0.2%         3.7%    Other Revenue
                                 Fines and Fees
                                                                       0.7%
                                    2.2%
                            Intragovernmental                                            Property Taxes
                                2.1%                                                        27.7%


                Charges for Services
                    42.9%


                                                                                            Sales Tax & Other Taxes
                                                                                                 19.5%


                                                         Licenses and Permits
                                                              1.0%


                                                             34