
Page 131 - Hurst FY19 Approved Budget
P. 131
GENERAL FUND
PERCENTAGE COMPARISON TO LAST YEAR’S BUDGET
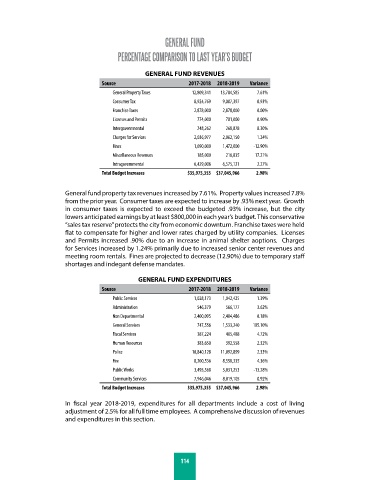
GENERAL FUND REVENUES
Source 2017-2018 2018-2019 Variance
General Property Taxes 12,809,341 13,784,585 7.61%
Consumer Tax 8,924,769 9,007,397 0.93%
Franchise Taxes 2,878,000 2,878,000 0.00%
Licenses and Permits 774,000 781,000 0.90%
Intergovernmental 248,262 268,878 8.30%
Charges for Services 2,036,977 2,062,150 1.24%
Fines 1,690,000 1,472,000 -12.90%
Miscellaneous Revenues 185,000 216,835 17.21%
Intragovernmental 6,429,006 6,575,121 2.27%
Total Budget Increases $35,975,355 $37,045,966 2.98%
General fund property tax revenues increased by 7.61%. Property values increased 7.8%
from the prior year. Consumer taxes are expected to increase by .93% next year. Growth
in consumer taxes is expected to exceed the budgeted .93% increase, but the city
lowers anticipated earnings by at least $800,000 in each year’s budget. This conservative
“sales tax reserve” protects the city from economic downturn. Franchise taxes were held
flat to compensate for higher and lower rates charged by utility companies. Licenses
and Permits increased .90% due to an increase in animal shelter aoptions. Charges
for Services increased by 1.24% primarily due to increased senior center revenues and
meeting room rentals. Fines are projected to decrease (12.90%) due to temporary staff
shortages and indegant defense mandates.
GENERAL FUND EXPENDITURES
Source 2017-2018 2018-2019 Variance
Public Services 1,028,173 1,042,425 1.39%
Administration 546,379 566,177 3.62%
Non Departmental 2,400,095 2,404,486 0.18%
General Services 747,556 1,533,240 105.10%
Fiscal Services 387,224 405,488 4.72%
Human Resources 383,650 392,558 2.32%
Police 10,840,128 11,092,899 2.33%
Fire 8,200,536 8,558,335 4.36%
Public Works 3,495,568 3,031,253 -13.28%
Community Services 7,946,046 8,019,105 0.92%
Total Budget Increases $35,975,355 $37,045,966 2.98%
In fiscal year 2018-2019, expenditures for all departments include a cost of living
adjustment of 2.5% for all full time employees. A comprehensive discussion of revenues
and expenditures in this section.
114