
Page 31 - Haltom City FY19 Annual Budget
P. 31
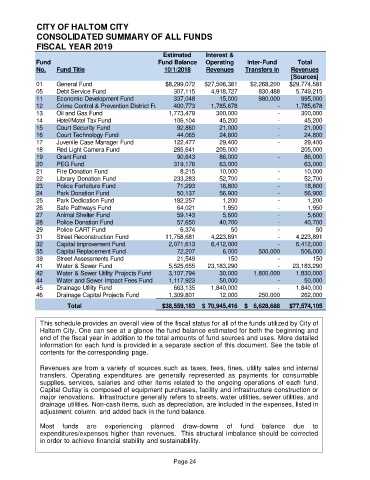
CITY OF HALTOM CITY
             CONSOLIDATED SUMMARY OF ALL FUNDS
             FISCAL YEAR 2019
                                                       Estimated     Interest &
             Fund                                    Fund Balance    Operating     Inter-Fund       Total
             No.    Fund Title                         10/1/2018     Revenues     Transfers In   Revenues
                                                                                                 [Sources]
             01     General Fund                        $8,299,072   $27,506,381    $2,268,200   $29,774,581
             05     Debt Service Fund                     307,115      4,918,727           830,488         5,749,215
             11     Economic Development Fund             337,048         15,000           980,000           995,000
             12     Crime Control & Prevention District Fund  400,773  1,785,678                      -         1,785,678
             13     Oil and Gas Fund                     1,773,479       300,000                      -           300,000
             14     Hotel/Motel Tax Fund                  106,104         45,200                      -             45,200
             15     Court Security Fund                     92,860        21,000                      -             21,000
             16     Court Technology Fund                   44,065        24,800                      -             24,800
             17     Juvenile Case Manager Fund            122,477         29,400                      -             29,400
             18     Red Light Camera Fund                 285,641        205,000                         205,000
             19     Grant Fund                              90,643        86,000                      -             86,000
             20     PEG Fund                              319,176         63,000                           63,000
             21     Fire Donation Fund                       8,215        10,000                      -             10,000
             22     Library Donation Fund                 233,283         52,700                      -             52,700
             23     Police Forfeiture Fund                  71,293        18,800                      -             18,800
             24     Park Donation Fund                      50,137        56,900                      -             56,900
             25     Park Dedication Fund                  182,257          1,200                      -               1,200
             26     Safe Pathways Fund                      64,021         1,950                      -               1,950
             27     Animal Shelter Fund                     59,143         5,600                      -               5,600
             28     Police Donation Fund                    57,650        40,700                      -             40,700
             29     Police CART Fund                         6,374           50                       -                    50
             31     Street Reconstruction Fund          11,758,681     4,223,891                      -         4,223,891
             32     Capital Improvement Fund             2,071,613     6,412,000                      -         6,412,000
             35     Capital Replacement Fund                72,207         6,000           500,000           506,000
             39     Street Assessments Fund                 21,549          150                       -                  150
             41     Water & Sewer Fund                   5,525,655    23,183,290                      -       23,183,290
             42     Water & Sewer Utility Projects Fund  3,107,794        30,000         1,800,000         1,830,000
             44     Water and Sewer Impact Fees Fund     1,117,923        50,000                      -             50,000
             45     Drainage Utility Fund                 663,135      1,840,000                      -         1,840,000
             46     Drainage Capital Projects Fund       1,309,801        12,000           250,000           262,000
                          Total                        $38,559,183  $   70,945,416  $     6,628,688  $77,574,105


              This schedule provides an overall view of the fiscal status for all of the funds utilized by City of
              Haltom City. One can see at a glance the fund balance estimated for both the beginning and
              end of the fiscal year in addition to the total amounts of fund sources and uses. More detailed
              information for each fund is provided in a separate section of this document. See the table of
              contents for the corresponding page.

              Revenues are from a variety of sources such as taxes, fees, fines, utility sales and internal
              transfers. Operating expenditures are generally represented as payments for consumable
              supplies, services, salaries and other items related to the ongoing operations of each fund.
              Capital Outlay is composed of equipment purchases, facility and infrastructure construction or
              major renovations. Infrastructure generally refers to streets, water utilities, sewer utilities, and
              drainage utilities. Non-cash items, such as depreciation, are included in the expenses, listed in
              adjustment column, and added back in the fund balance.

              Most    funds   are   experiencing   planned    draw-downs    of   fund   balance   due   to
              expenditures/expenses higher than revenues. This structural imbalance should be corrected
              in order to achieve financial stability and sustainablility.


                                                          Page 24