Page 28 - Grapevine FY19 Operating Budget
P. 28

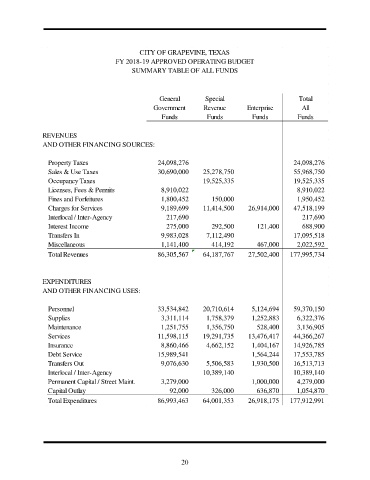
CITY OF GRAPEVINE, TEXAS
                                       FY 2018-19 APPROVED OPERATING BUDGET
                                             SUMMARY TABLE OF ALL FUNDS


                                                      General        Special                        Total
                                                    Government      Revenue        Enterprise        All
                                                       Funds         Funds          Funds          Funds


               REVENUES
               AND OTHER FINANCING SOURCES:

                 Property Taxes                      24,098,276                                   24,098,276
                 Sales & Use Taxes                   30,690,000     25,278,750                    55,968,750
                 Occupancy Taxes                                    19,525,335                    19,525,335
                 Licenses, Fees & Permits             8,910,022                                    8,910,022
                 Fines and Forfeitures                1,800,452        150,000                     1,950,452
                 Charges for Services                 9,189,699     11,414,500     26,914,000     47,518,199
                 Interlocal / Inter-Agency              217,690                                      217,690
                 Interest Income                        275,000        292,500        121,400        688,900
                 Transfers In                         9,983,028      7,112,490                    17,095,518
                 Miscellaneous                        1,141,400        414,192        467,000      2,022,592

                 Total Revenues                      86,305,567     64,187,767     27,502,400    177,995,734


               EXPENDITURES
               AND OTHER FINANCING USES:


                 Personnel                           33,534,842     20,710,614      5,124,694     59,370,150
                 Supplies                             3,311,114      1,758,379      1,252,883      6,322,376
                 Maintenance                          1,251,755      1,356,750        528,400      3,136,905
                 Services                            11,598,115     19,291,735     13,476,417     44,366,267
                 Insurance                            8,860,466      4,662,152      1,404,167     14,926,785
                 Debt Service                        15,989,541                     1,564,244     17,553,785
                 Transfers Out                        9,076,630      5,506,583      1,930,500     16,513,713
                 Interlocal / Inter-Agency                          10,389,140                    10,389,140
                 Permanent Capital / Street Maint.    3,279,000                     1,000,000      4,279,000
                 Capital Outlay                          92,000        326,000        636,870      1,054,870
                 Total Expenditures                  86,993,463     64,001,353     26,918,175    177,912,991


                                                             20
   23   24   25   26   27   28   29   30   31   32   33