Page 26 - Grapevine FY19 Operating Budget
P. 26

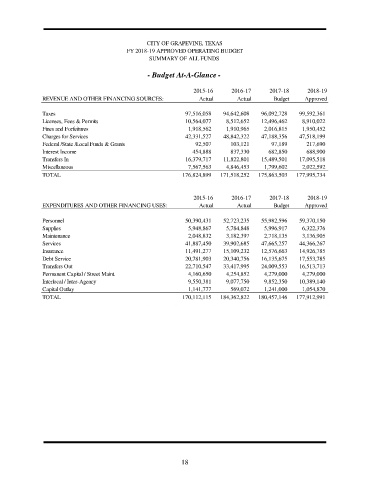
CITY OF GRAPEVINE, TEXAS
                                           FY 2018-19 APPROVED OPERATING BUDGET
                                                  SUMMARY OF ALL FUNDS

                                                  - Budget At-A-Glance -


                                                                 2015-16      2016-17     2017-18      2018-19
               REVENUE AND OTHER FINANCING SOURCES:                Actual      Actual       Budget    Approved

               Taxes                                          97,516,058   94,642,608  96,092,728   99,592,361
               Licenses, Fees & Permits                       10,564,077    8,512,652  12,496,462    8,910,022
               Fines and Forfeitures                           1,918,562    1,910,965   2,016,815    1,950,452
               Charges for Services                           42,331,527   48,842,322  47,188,356   47,518,199
               Federal /State /Local Funds & Grants               92,507     103,121       97,189     217,690
               Interest Income                                   454,888     837,330      682,850     688,900
               Transfers In                                   16,379,717   11,822,801  15,489,501   17,095,518
               Miscellaneous                                   7,567,563    4,846,453   1,799,602    2,022,592
               TOTAL                                         176,824,899  171,518,252  175,863,503  177,995,734


                                                                 2015-16      2016-17     2017-18      2018-19
               EXPENDITURES AND OTHER FINANCING USES:              Actual      Actual       Budget    Approved

               Personnel                                      50,390,431   52,723,235  55,982,596   59,370,150
               Supplies                                        5,948,867    5,784,848   5,996,917    6,322,376
               Maintenance                                     2,048,832    3,182,397   2,718,135    3,136,905
               Services                                       41,887,450   39,902,685  47,665,257   44,366,267
               Insurance                                      11,491,277   15,109,232  12,576,663   14,926,785
               Debt Service                                   20,781,903   20,340,756  16,135,675   17,553,785
               Transfers Out                                  22,710,547   33,417,995  24,009,553   16,513,713
               Permanent Capital / Street Maint.               4,160,650    4,254,852   4,279,000    4,279,000
               Interlocal / Inter-Agency                       9,550,381    9,077,750   9,852,350   10,389,140
               Capital Outlay                                  1,141,777     569,072    1,241,000    1,054,870
               TOTAL                                         170,112,115  184,362,822  180,457,146  177,912,991


                                                             18
   21   22   23   24   25   26   27   28   29   30   31