
Page 123 - Colleyville FY19 Budget
P. 123
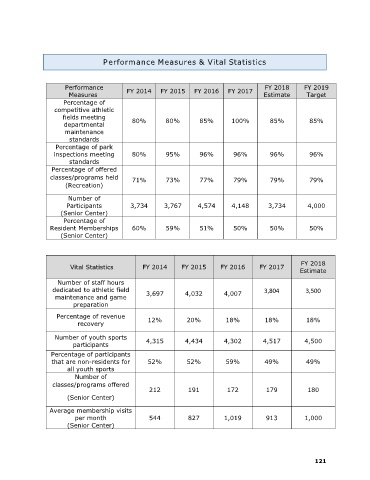
Performance Measures & Vital Statistics

                       Performance         FY 2014   FY 2015   FY 2016      FY 2017      FY 2018      FY 2019
                        Measures                                                        Estimate      Target
                      Percentage of
                   competitive athletic
                      fields meeting         80%        80%        85%        100%        85%          85%
                      departmental
                      maintenance
                        standards
                   Percentage of park
                   inspections meeting       80%        95%        96%        96%         96%          96%
                        standards
                  Percentage of offered
                  classes/programs held      71%        73%        77%        79%         79%          79%
                       (Recreation)

                        Number of
                       Participants         3,734      3,767      4,574       4,148       3,734        4,000
                     (Senior Center)
                      Percentage of
                  Resident Memberships       60%        59%        51%        50%         50%          50%
                     (Senior Center)


                                                                                                     FY 2018
                         Vital Statistics       FY 2014      FY 2015      FY 2016      FY 2017
                                                                                                    Estimate
                    Number of staff hours
                  dedicated to athletic field    3,697        4,032        4,007        3,804         3,500
                   maintenance and game
                         preparation
                    Percentage of revenue         12%          20%          18%          18%          18%
                           recovery

                   Number of youth sports        4,315        4,434        4,302        4,517         4,500
                         participants
                  Percentage of participants
                  that are non-residents for      52%          52%          59%          49%          49%
                       all youth sports
                          Number of
                  classes/programs offered
                                                  212          191          172          179           180
                       (Senior Center)

                 Average membership visits
                          per month               544          827         1,019         913          1,000
                       (Senior Center)


                                                                                                         121