
Page 144 - Honorable Mayor and Members of the City Council
P. 144
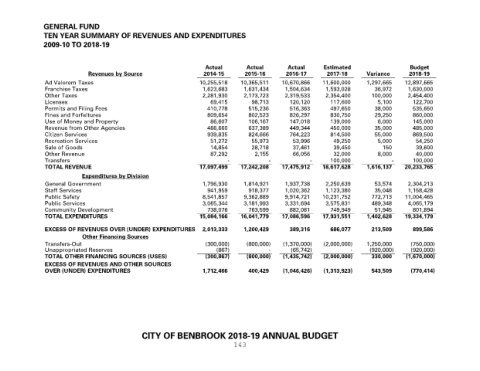
GENERAL FUND
               TEN YEAR SUMMARY OF REVENUES AND EXPENDITURES
               2009-10 TO 2018-19


                                                                     Actual       Actual        Actual      Estimated                   Budget
                              Revenues by Source                    2014-15       2015-16      2016-17       2017-18      Variance      2018-19
                Ad Valorem Taxes                                   10,255,518   10,365,511    10,670,866   11,600,000     1,297,665    12,897,665
                Franchise Taxes                                     1,623,683    1,631,434     1,504,634    1,593,028        36,972     1,630,000
                Other Taxes                                         2,281,930    2,173,723     2,319,533    2,354,400       100,000     2,454,400
                Licenses                                              69,415        98,713       120,120      117,600         5,100      122,700
                Permits and Filing Fees                              410,778       515,236       516,363      497,650        38,000      535,650
                Fines and Forfeitures                                809,654       802,523       826,297      830,750        29,250      860,000
                Use of Money and Property                             86,607       106,167       147,018      139,000         6,000      145,000
                Revenue from Other Agencies                          466,660       637,389       449,344      450,000        35,000      485,000
                Citizen Services                                     939,835       824,666       764,223      814,500        55,000      869,500
                Recreation Services                                   51,272        55,973        53,996       49,250         5,000       54,250
                Sale of Goods                                         14,854        28,718        37,461       39,450          150        39,600
                Other Revenue                                         87,292         2,155        66,056       32,000         8,000       40,000
                Transfers                                                   -             -            -      100,000             -      100,000
                TOTAL REVENUE                                      17,097,499    17,242,208    17,475,912    18,617,628    1,616,137    20,233,765
                            Expenditures by Division
                General Government                                  1,796,930    1,814,921     1,937,738    2,250,639        53,574     2,304,213
                Staff Services                                       941,959       918,377     1,020,362    1,123,380        35,048     1,158,428
                Public Safety                                       8,541,857    9,362,889     9,914,721   10,231,752       772,713    11,004,465
                Public Services                                     3,065,344    3,181,993     3,331,694    3,575,831       489,348     4,065,179
                Community Development                                738,076       763,599       882,081      749,949        51,945      801,894
                TOTAL EXPENDITURES                                 15,084,166   16,041,779    17,086,596   17,931,551     1,402,628    19,334,179
                EXCESS OF REVENUES OVER (UNDER) EXPENDITURES        2,013,333    1,200,429       389,316      686,077       213,509      899,586
                            Other Financing Sources
                Transfers-Out                                        (300,000)    (800,000)   (1,370,000)    (2,000,000)  1,250,000      (750,000)
                Unappropriated Reserves                                 (867)             -      (65,742)            -     (920,000)     (920,000)
                TOTAL OTHER FINANCING SOURCES (USES)                 (300,867)    (800,000)    (1,435,742)    (2,000,000)    330,000   (1,670,000)
                EXCESS OF REVENUES AND OTHER SOURCES
                OVER (UNDER) EXPENDITURES                           1,712,466      400,429    (1,046,426)    (1,313,923)    543,509      (770,414)


                                                CITY OF BENBROOK 2018-19 ANNUAL BUDGET
                                                                              143