
Page 118 - Honorable Mayor and Members of the City Council
P. 118
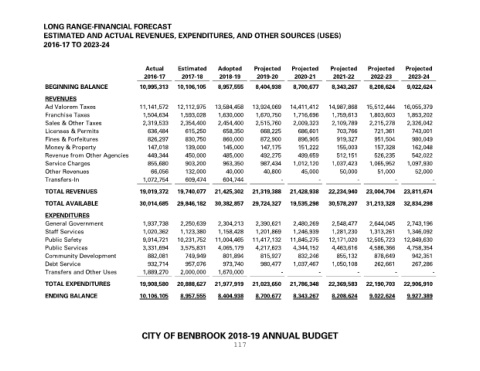
LONG RANGE-FINANCIAL FORECAST
               ESTIMATED AND ACTUAL REVENUES, EXPENDITURES, AND OTHER SOURCES (USES)
               2016-17 TO 2023-24


                                                 Actual     Estimated    Adopted     Projected   Projected    Projected   Projected    Projected
                                                 2016-17     2017-18     2018-19      2019-20     2020-21      2021-22     2022-23      2023-24
                BEGINNING BALANCE              10,995,313  10,106,105    8,957,555   8,404,938    8,700,677    8,343,267   8,208,624   9,022,624

                REVENUES
                Ad Valorem Taxes               11,141,572  12,112,975   13,584,458   13,924,069   14,411,412  14,987,868  15,512,444  16,055,379
                Franchise Taxes                 1,504,634    1,593,028   1,630,000   1,670,750    1,716,696    1,759,613   1,803,603   1,853,202
                Sales & Other Taxes             2,319,533    2,354,400   2,454,400   2,515,760    2,009,323    2,109,789   2,215,278   2,326,042
                Licenses & Permits                636,484     615,250      658,350     668,225     686,601      703,766      721,361     743,001
                Fines & Forfeitures               826,297     830,750      860,000     872,900     896,905      919,327      951,504     980,049
                Money & Property                  147,018     139,000      145,000     147,175     151,222      155,003      157,328     162,048
                Revenue from Other Agencies       449,344     450,000      485,000     492,275     499,659      512,151      526,235     542,022
                Service Charges                   855,680     903,200      963,350     987,434   1,012,120     1,037,423   1,065,952   1,097,930
                Other Revenues                     66,056     132,000       40,000      40,800      45,000       50,000       51,000      52,000
                Transfers-In                    1,072,754     609,474      604,744            -           -            -           -            -

                TOTAL REVENUES                 19,019,372  19,740,077   21,425,302  21,319,388   21,428,938  22,234,940   23,004,704  23,811,674

                TOTAL AVAILABLE                30,014,685  29,846,182   30,382,857  29,724,327   19,535,298  30,578,207   31,213,328  32,834,298

                EXPENDITURES
                General Government              1,937,738    2,250,639   2,304,213   2,390,621    2,480,269    2,548,477   2,644,045   2,743,196
                Staff Services                  1,020,362    1,123,380   1,158,428   1,201,869    1,246,939    1,281,230   1,313,261   1,346,092
                Public Safety                   9,914,721  10,231,752   11,004,465  11,417,132   11,845,275  12,171,020   12,505,723  12,849,630
                Public Services                 3,331,694    3,575,831   4,065,179   4,217,623    4,344,152    4,463,616   4,586,366   4,758,354
                Community Development             882,081     749,949      801,894     815,927     832,246      855,132      878,649     942,351
                Debt Service                      932,714     957,076      973,740     980,477    1,037,467    1,050,108     262,661     267,286
                Transfers and Other Uses        1,889,270    2,000,000   1,670,000            -           -            -           -            -

                TOTAL EXPENDITURES             19,908,580  20,888,627   21,977,919  21,023,650   21,786,348  22,369,583   22,190,703  22,906,910
                ENDING BALANCE                 10,106,105    8,957,555   8,404,938   8,700,677    8,343,267    8,208,624   9,022,624   9,927,389


                                                CITY OF BENBROOK 2018-19 ANNUAL BUDGET
                                                                              117