
Page 190 - City of Arlington FY19 Adopted Operating Budget
P. 190
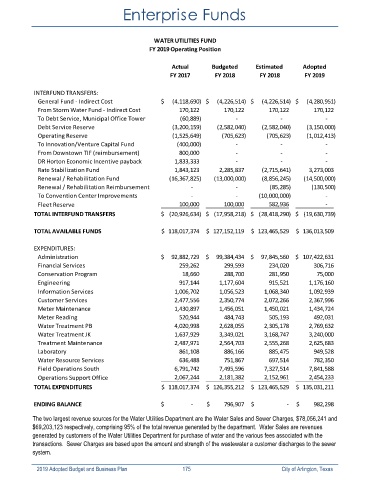
Enterprise Funds


                                                    WATER UTILITIES FUND
                                                  FY 2019 Operating Position

                                                          Actual       Budgeted       Estimated      Adopted
                                                         FY 2017        FY 2018        FY 2018        FY 2019


            INTERFUND TRANSFERS:
              General Fund ‐ Indirect Cost            $        (4,118,690) $        (4,226,514) $        (4,226,514) $        (4,280,951)
              From Storm Water Fund ‐ Indirect Cost                   170,122                 170,122                 170,122                 170,122
              To Debt Service, Municipal Office Tower                  (60,889)                          ‐                           ‐                           ‐
              Debt Service Reserve                              (3,200,159)           (2,582,040)           (2,582,040)           (3,150,000)
              Operating Reserve                                 (1,525,649)               (705,623)               (705,623)           (1,012,413)
              To Innovation/Venture Capital Fund                    (400,000)                          ‐                           ‐                           ‐
              From Downtown TIF (reimbursement)                       800,000                          ‐                           ‐                           ‐
              DR Horton Economic Incentive payback                1,833,333                          ‐                           ‐                           ‐
              Rate Stabilization Fund                             1,843,123             2,285,837           (2,715,641)             3,273,003
              Renewal / Rehabilitation Fund                   (16,367,825)         (13,000,000)           (8,856,245)         (14,500,000)
              Renewal / Rehabilitation Reimbursement                           ‐                           ‐                  (85,285)               (130,500)
              To Convention Center Improvements                                ‐                           ‐          (10,000,000)                          ‐
              Fleet Reserve                                           100,000                 100,000                   582,936                          ‐
            TOTAL INTERFUND TRANSFERS                 $      (20,926,634) $      (17,958,218) $      (28,418,290) $      (19,630,739)

            TOTAL AVAILABLE FUNDS                     $     118,017,374  $     127,152,119  $     123,465,529  $     136,013,509


            EXPENDITURES:
              Administration                          $       92,882,729 $       99,384,434 $       97,845,560 $     107,422,631
              Financial Services                                      259,262                 299,593                 234,020                 306,716
              Conservation Program                                      18,660                 288,700                 281,950                   75,000
              Engineering                                             917,144             1,177,604                 915,521             1,176,160
              Information Services                                1,006,702             1,056,523             1,068,340             1,092,939
              Customer Services                                   2,477,556             2,350,774             2,072,266             2,367,996
              Meter Maintenance                                   1,430,897             1,456,051             1,450,021             1,434,724
              Meter Reading                                           520,944                 484,743                 505,193                 492,031
              Water Treatment PB                                  4,020,998             2,628,055             2,305,178             2,769,632
              Water Treatment JK                                  1,637,929             3,349,021             3,168,747             3,240,000
              Treatment Maintenance                               2,487,971             2,564,703             2,555,268             2,625,683
              Laboratory                                              861,108                 886,166                 885,475                 949,528
              Water Resource Services                                 636,488                 751,867                 697,514                 782,350
              Field Operations South                              6,791,742             7,495,596             7,327,514             7,841,588
              Operations Support Office                           2,067,244             2,181,382             2,152,961             2,454,233
            TOTAL EXPENDITURES                        $     118,017,374  $     126,355,212  $     123,465,529  $     135,031,211


            ENDING BALANCE                            $                      ‐  $             796,907  $                           ‐  $             982,298

            The two largest revenue sources for the Water Utilities Department are the Water Sales and Sewer Charges, $78,056,241 and
            $69,203,123 respectively, comprising 95% of the total revenue generated by the department.  Water Sales are revenues
            generated by customers of the Water Utilities Department for purchase of water and the various fees associated with the
            transactions.  Sewer Charges are based upon the amount and strength of the wastewater a customer discharges to the sewer
            system.


             2019 Adopted Budget and Business Plan                                        175                                                                  City of Arlington, Texas