
Page 189 - City of Arlington FY19 Adopted Operating Budget
P. 189
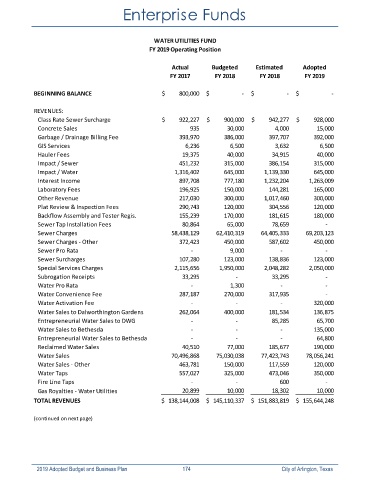
Enterprise Funds


                                                    WATER UTILITIES FUND
                                                  FY 2019 Operating Position

                                                          Actual       Budgeted       Estimated      Adopted
                                                         FY 2017        FY 2018        FY 2018        FY 2019


            BEGINNING BALANCE                          $             800,000  $                           ‐  $                           ‐  $                           ‐

            REVENUES:
              Class Rate Sewer Surcharge               $             922,227  $             900,000  $             942,277  $             928,000
              Concrete Sales                                                  935                   30,000                     4,000                   15,000
              Garbage / Drainage Billing Fee                          393,970                 386,000                 397,707                 392,000
              GIS Services                                                6,236                     6,500                     3,632                     6,500
              Hauler Fees                                               19,375                   40,000                   34,915                   40,000
              Impact / Sewer                                          451,232                 315,000                 386,154                 315,000
              Impact / Water                                      1,316,402                 645,000             1,139,330                 645,000
              Interest Income                                         897,708                 777,180             1,232,204             1,263,009
              Laboratory Fees                                         196,925                 150,000                 144,281                 165,000
              Other Revenue                                           217,030                 300,000             1,017,460                 300,000
              Plat Review & Inspection Fees                           290,743                 120,000                 304,556                 120,000
              Backflow Assembly and Tester Regis.                     155,239                 170,000                 181,615                 180,000
              Sewer Tap Installation Fees                               80,864                   65,000                   78,659                          ‐
              Sewer Charges                                     58,438,129           62,410,319           64,405,333           69,203,123
              Sewer Charges ‐ Other                                   372,423                 450,000                 587,602                 450,000
              Sewer Pro Rata                                                   ‐                      9,000                          ‐                           ‐
              Sewer Surcharges                                        107,280                 123,000                 138,836                 123,000
              Special Services Charges                            2,115,656             1,950,000             2,048,282             2,050,000
              Subrogation Receipts                                      33,295                          ‐                    33,295                          ‐
              Water Pro Rata                                                   ‐                      1,300                          ‐                           ‐
              Water Convenience Fee                                   287,187                 270,000                 317,935                          ‐
              Water Activation Fee                                             ‐                           ‐                           ‐                  320,000
              Water Sales to Dalworthington Gardens                   262,064                 400,000                 181,534                 136,875
              Entrepreneurial Water Sales to DWG                               ‐                           ‐                    85,285                   65,700
              Water Sales to Bethesda                                          ‐                           ‐                           ‐                  135,000
              Entrepreneurial Water Sales to Bethesda                           ‐                           ‐                           ‐                    64,800
              Reclaimed Water Sales                                     40,510                   77,000                 185,677                 190,000
              Water Sales                                       70,496,868           75,030,038           77,423,743           78,056,241
              Water Sales ‐ Other                                     463,781                 150,000                 117,559                 120,000
              Water Taps                                              557,027                 325,000                 473,046                 350,000
              Fire Line Taps                                                   ‐                           ‐                          600                          ‐
              Gas Royalties ‐ Water Utilities                           20,899                   10,000                   18,302                   10,000
            TOTAL REVENUES                            $     138,144,008  $     145,110,337  $     151,883,819  $     155,644,248


            (continued on next page)


             2019 Adopted Budget and Business Plan                                        174                                                                  City of Arlington, Texas