
Page 69 - FY 19 Budget Forecast 91218.xlsx
P. 69
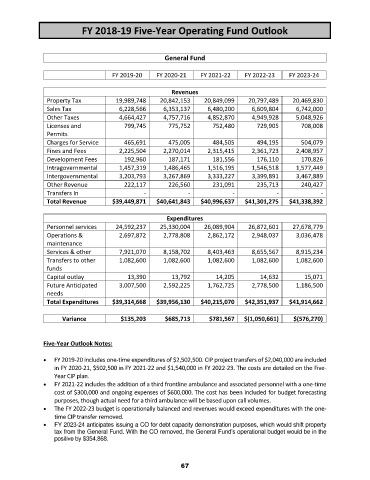
FY 2018‐19 Five‐Year Operating Fund Outlook
General Fund
FY 2019‐20 FY 2020‐21 FY 2021‐22 FY 2022‐23 FY 2023‐24
Revenues
Property Tax 19,989,748 20,842,153 20,849,099 20,797,489 20,469,830
Sales Tax 6,228,566 6,353,137 6,480,200 6,609,804 6,742,000
Other Taxes 4,664,427 4,757,716 4,852,870 4,949,928 5,048,926
Licenses and 799,745 775,752 752,480 729,905 708,008
Permits
Charges for Service 465,691 475,005 484,505 494,195 504,079
Fines and Fees 2,225,504 2,270,014 2,315,415 2,361,723 2,408,957
Development Fees 192,960 187,171 181,556 176,110 170,826
Intragovernmental 1,457,319 1,486,465 1,516,195 1,546,518 1,577,449
Intergovernmental 3,203,793 3,267,869 3,333,227 3,399,891 3,467,889
Other Revenue 222,117 226,560 231,091 235,713 240,427
Transfers In ‐ ‐ ‐ ‐ ‐
Total Revenue $39,449,871 $40,641,843 $40,996,637 $41,301,275 $41,338,392
Expenditures
Personnel services 24,592,237 25,330,004 26,089,904 26,872,601 27,678,779
Operations & 2,697,872 2,778,808 2,862,172 2,948,037 3,036,478
maintenance
Services & other 7,921,070 8,158,702 8,403,463 8,655,567 8,915,234
Transfers to other 1,082,600 1,082,600 1,082,600 1,082,600 1,082,600
funds
Capital outlay 13,390 13,792 14,205 14,632 15,071
Future Anticipated 3,007,500 2,592,225 1,762,725 2,778,500 1,186,500
needs
Total Expenditures $39,314,668 $39,956,130 $40,215,070 $42,351,937 $41,914,662
Variance $135,203 $685,713 $781,567 $(1,050,661) $(576,270)
Five‐Year Outlook Notes:
FY 2019‐20 includes one‐time expenditures of $2,502,500. CIP project transfers of $2,040,000 are included
in FY 2020‐21, $502,500 in FY 2021‐22 and $1,540,000 in FY 2022‐23. The costs are detailed on the Five‐
Year CIP plan.
FY 2021‐22 includes the addition of a third frontline ambulance and associated personnel with a one‐time
cost of $300,000 and ongoing expenses of $600,000. The cost has been included for budget forecasting
purposes, though actual need for a third ambulance will be based upon call volumes.
The FY 2022‐23 budget is operationally balanced and revenues would exceed expenditures with the one‐
time CIP transfer removed.
FY 2023-24 anticipates issuing a CO for debt capacity demonstration purposes, which would shift property
tax from the General Fund. With the CO removed, the General Fund’s operational budget would be in the
positive by $354,868.
67