
Page 350 - FY 19 Budget Forecast 91218.xlsx
P. 350
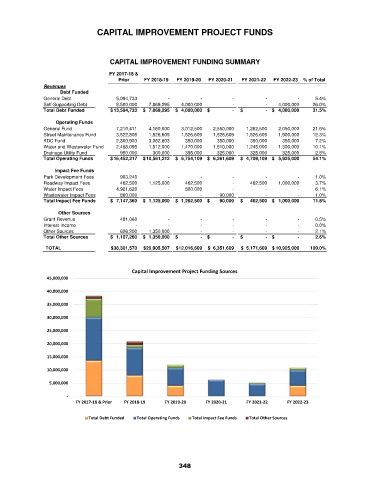
CAPITAL IMPROVEMENT PROJECT FUNDS


                                     CAPITAL IMPROVEMENT FUNDING SUMMARY

                                     FY 2017-18 &
                                        Prior    FY 2018-19  FY 2019-20  FY 2020-21  FY 2021-22  FY 2022-23  % of Total
               Revenues
                     Debt Funded
               General Debt                 5,094,733                       -                       -                       -                       -                       -  5.4%
               Self-Supporting Debt         8,500,000        7,869,295        4,000,000                       -                       -         4,000,000  26.0%
               Total Debt Funded      $ 13,594,733  $    7,869,295  $    4,000,000  $                   -  $                   -  $     4,000,000  31.5%

                   Operating Funds
               General Fund                 7,210,411        4,160,000        3,012,500        2,550,000        1,262,500         2,050,000  21.6%
               Street Maintenance Fund        3,522,808        1,526,609        1,526,609        1,526,609        1,526,609         1,900,000  12.3%
               KDC Fund                     2,300,903        3,062,603           350,000           350,000           350,000            350,000  7.2%
               Water and Wastewater Fund        2,468,095        1,512,000        1,470,000        1,510,000        1,245,000         1,300,000  10.1%
               Drainage Utility Fund           950,000           300,000           395,000           325,000           325,000            325,000  2.8%
               Total Operating Funds  $ 16,452,217  $ 10,561,212  $    6,754,109  $    6,261,609  $    4,709,109  $     5,925,000  54.1%

                   Impact Fee Funds
               Park Development Fees           903,240                       -                       -                       -                       -                       -  1.0%
               Roadway Impact Fees             462,500        1,125,000           462,500                       -           462,500         1,000,000  3.7%
               Water Impact Fees            4,921,620                       -           800,000                       -                       -                       -  6.1%
               Wastewater Impact Fees           860,000                       -                       -             90,000                       -                       -  1.0%
               Total Impact Fee Funds  $    7,147,360  $    1,125,000  $    1,262,500  $         90,000  $       462,500  $     1,000,000  11.8%
                    Other Sources
               Grant Revenue                   481,060                       -                       -                       -                       -                       -  0.5%
               Interest Income                             -                       -                       -                       -                       -                       -  0.0%
               Other Sources                   626,200        1,350,000                       -                       -                       -                       -  2.1%
               Total Other Sources    $    1,107,260  $    1,350,000  $                   -  $                   -  $                   -  $                   -  2.6%

                TOTAL                 $ 38,301,570  $ 20,905,507  $ 12,016,609  $   6,351,609  $   5,171,609  $   10,925,000  100.0%


                                             Capital Improvement Project Funding Sources
                 45,000,000

                 40,000,000
                 35,000,000

                 30,000,000

                 25,000,000
                 20,000,000

                 15,000,000

                 10,000,000
                  5,000,000

                        ‐
                          FY 2017‐18 & Prior  FY 2018‐19  FY 2019‐20  FY 2020‐21   FY 2021‐22   FY 2022‐23


                              Total Debt Funded  Total Operating Funds  Total Impact Fee Funds  Total Other Sources


                                                            348