


Page 149 - FY 2026-2027 Adopted Budget Book
P. 149
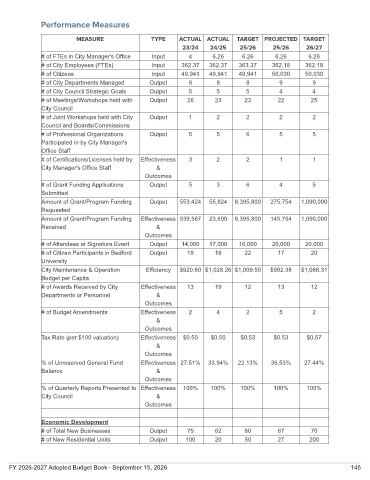
Performance Measures


                          MEASURE                  TYPE     ACTUAL ACTUAL      TARGET PROJECTED TARGET
                                                             23/24     24/25    25/26      25/26      26/27
               # of FTEs in City Manager's Office  Input        4      6.26      6.26       6.26       6.26
               # of City Employees (FTEs)          Input     362.37   362.37    363.37     362.18     362.18
               # of Citizens                       Input     49,941   49,941    49,941     50,030     50,030
               # of City Departments Managed      Output        8        8        8          9          9
               # of City Council Strategic Goals  Output        5        5        5          4          4
               # of Meetings/Workshops held with  Output       26       23        23         22         25
               City Council
               # of Joint Workshops held with City  Output      1        2        2          2          2
               Council and Boards/Commissions
               # of Professional Organizations    Output        5        5        6          5          5
               Participated in by City Manager's
               Office Staff
               # of Certifications/Licenses held by  Effectiveness  3    2        2          1          1
               City Manager's Office Staff           &
                                                 Outcomes
               # of Grant Funding Applications    Output        5        3        6          4          5
               Submitted
               Amount of Grant/Program Funding    Output     553,424  55,824   8,395,800  275,754    1,090,000
               Requested
               Amount of Grant/Program Funding  Effectiveness 539,587  23,600  8,395,800  145,754    1,090,000
               Received                              &
                                                 Outcomes
               # of Attendees at Signature Event  Output     14,000   17,000    16,000     20,000     20,000
               # of Citizen Participants in Bedford  Output    19       18        22         17         20
               University
               City Maintenance & Operation      Efficiency  $920.80 $1,028.26 $1,009.50  $992.38    $1,088.31
               Budget per Capita
               # of Awards Received by City     Effectiveness  13       19        12         13         12
               Departments or Personnel              &
                                                 Outcomes
               # of Budget Amendments           Effectiveness   2        4        2          5          2
                                                     &
                                                 Outcomes
               Tax Rate (per $100 valuation)    Effectiveness  $0.50   $0.50     $0.53      $0.53      $0.57
                                                     &
                                                 Outcomes
               % of Unreserved General Fund     Effectiveness 27.51%  33.94%    22.13%     36.53%     27.44%
               Balance                               &
                                                 Outcomes
               % of Quarterly Reports Presented to Effectiveness  100%  100%     100%      100%       100%
               City Council                          &
                                                 Outcomes

               Economic Development
               # of Total New Businesses          Output       75       62        80         67         70
               # of New Residential Units         Output      100       20        50         27        200


    FY 2026-2027 Adopted Budget Book · September 15, 2026                                                            145

