Page 179 - CITY OF WATAUGA, TEXAS ANNUAL BUDGET PORTRAIT
P. 179

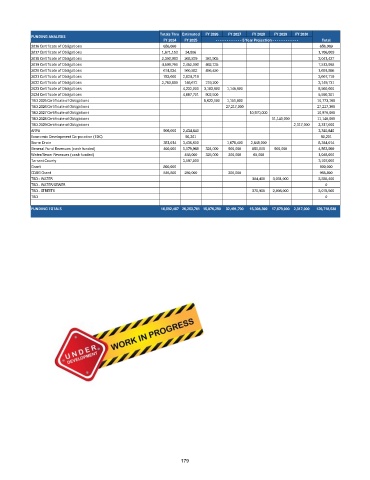
Totals Thru Estimated  FY 2026  FY 2027  FY 2028  FY 2029  FY 2030
           FUNDING ANALYSIS
                                                       FY 2024  FY 2025   - - - - - - - - - - - - 5 Year Projection - - - - - - - - - - - -  Total
           2016 Certificate of Obligations             656,069                                             656,069
           2017 Certificate of Obligations             1,671,153  34,856                                  1,706,009
           2018 Certificate of Obligations             2,390,993  268,529  381,905                        3,041,427
           2019 Certificate of Obligations             4,599,766  2,452,090  462,135                      7,513,992
           2020 Certificate of Obligations             674,834  560,582  456,450                          1,691,866
           2021 Certificate of Obligations             783,000  2,824,719                                 3,607,719
           2022 Certificate of Obligations             2,783,859  146,672  219,200                        3,149,731
           2023 Certificate of Obligations                    4,232,000  3,183,000  1,145,000             8,560,000
           2024 Certificate of Obligations                    4,687,701  902,500                          5,590,201
           TBD 2025 Certificate of Obligations                      9,622,100  1,151,000                  10,773,100
           TBD 2026 Certificate of Obligations                              27,217,300                    27,217,300
           TBD 2027 Certificate of Obligations                                      10,970,000            10,970,000
           TBD 2028 Certificate of Obligations                                             11,140,000     11,140,000
           TBD 2029 Certificate of Obligations                                                    2,317,000  2,317,000
           ARPA                                        906,000  2,434,840                                 3,340,840
           Economic Development Corporation (EDC)             90,201                                       90,201
           Storm Drain                                 381,014  3,436,600   1,678,400  2,848,000          8,344,014
           General Fund Revenues (cash funded)         400,000  1,179,969  324,000  900,000  850,000  900,000     4,553,969
           Water/Sewer Revenues (cash funded)                 458,000  325,000  200,000  65,000           1,048,000
           Tarrant County                                     3,197,000                                   3,197,000
           Grant                                       800,000                                             800,000
           CDBG Grant                                  545,800  250,000      200,000                       995,800
           TBD - WATER                                                              304,400  3,031,000    3,335,400
           TBD - WATER/SEWER                                                                                 0
           TBD - STREETS                                                            270,900  2,808,000    3,078,900
           TBD                                                                                               0
           FUNDING TOTALS                             16,592,487 26,253,761 15,876,290  32,491,700  15,308,300  17,879,000 2,317,000  126,718,538


                                                             179
   174   175   176   177   178   179   180   181   182   183   184