
Page 7 - CityofSansomParkFY26AdoptedBudget
P. 7
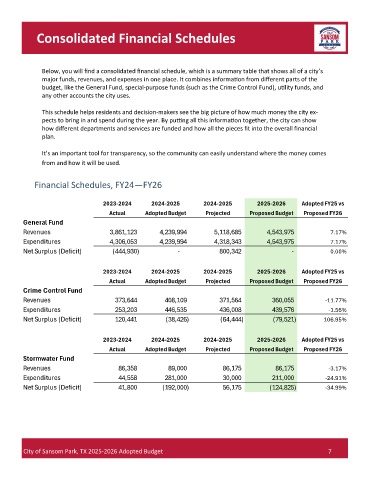
Consolidated Financial Schedules


               Below, you will find a consolidated financial schedule, which is a summary table that shows all of a city’s
               major funds, revenues, and expenses in one place. It combines information from different parts of the
               budget, like the General Fund, special-purpose funds (such as the Crime Control Fund), utility funds, and
               any other accounts the city uses.

               This schedule helps residents and decision-makers see the big picture of how much money the city ex-
               pects to bring in and spend during the year. By putting all this information together, the city can show
               how different departments and services are funded and how all the pieces fit into the overall financial
               plan.

               It’s an important tool for transparency, so the community can easily understand where the money comes
               from and how it will be used.


            Financial Schedules, FY24—FY26


                                   2023-2024       2024-2025        2024-2025         2025-2026      Adopted FY25 vs
                                     Actual      Adopted Budget      Projected      Proposed Budget  Proposed FY26
         General Fund
         Revenues                           3,861,123              4,239,994                 5,118,685                4,543,975  7.17%
         Expenditures                       4,306,053              4,239,994                 4,318,343                4,543,975  7.17%
         Net Surplus (Deficit)                (444,930)                          -                     800,342  -  0.00%


                                   2023-2024       2024-2025        2024-2025         2025-2026      Adopted FY25 vs
                                     Actual      Adopted Budget      Projected      Proposed Budget  Proposed FY26
         Crime Control Fund
         Revenues                              373,644                  408,109                     371,564                    360,055  -11.77%
         Expenditures                          253,203                  446,535                     436,008                    439,576  -1.56%
         Net Surplus (Deficit)                 120,441                  (38,426)                     (64,444)                    (79,521)  106.95%


                                   2023-2024       2024-2025        2024-2025         2025-2026      Adopted FY25 vs
                                     Actual      Adopted Budget      Projected      Proposed Budget  Proposed FY26
         Stormwater Fund
         Revenues                                 86,358                    89,000                       86,175                      86,175  -3.17%
         Expenditures                             44,558                  281,000                       30,000                    211,000  -24.91%
         Net Surplus (Deficit)                    41,800                (192,000)                       56,175                  (124,825)  -34.99%


         City of Sansom Park, TX 2025-2026 Adopted Budget                                                     7