
Page 40 - CityofKennedaleFY26AdoptedBudget
P. 40
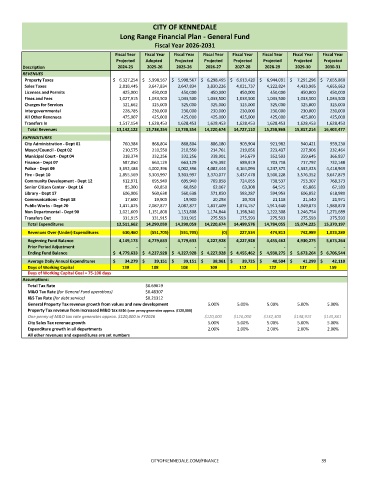
CITY OF KENNEDALE
                                      Long Range Financial Plan - General Fund
                                                  Fiscal Year 2026-2031
                                     Fiscal Year   Fiscal Year   Fiscal Year   Fiscal Year   Fiscal Year   Fiscal Year   Fiscal Year   Fiscal Year
                                     Projected    Adopted    Projected    Projected    Projected    Projected    Projected    Projected
      Description                     2024-25  2025-26   2025-26   2026-27  2027-28   2028-29   2029-30   2030-31
      REVENUES
        Property Taxes              $     6,327,254 $      5,998,567 $      5,998,567 $      6,298,495 $      6,613,420 $       6,944,091 $       7,291,296 $      7,655,860

        Sales Taxes                         2,818,445         3,647,834         3,647,834         3,830,226         4,021,737          4,222,824          4,433,965         4,655,663
        Licenses and Permits                   425,000            450,000            450,000            450,000            450,000             450,000             450,000            450,000
        Fines and Fees                      1,027,915         1,033,500         1,033,500         1,033,500         1,033,500          1,033,500          1,033,500         1,033,500
        Charges for Services                   321,662            325,000            325,000            325,000            325,000             325,000             325,000            325,000
        Intergovernmental                      228,785            230,000            230,000            230,000            230,000             230,000             230,000            230,000
        All Other Revenues                     475,907            425,000            425,000            425,000            425,000             425,000             425,000            425,000
        Transfers In                        1,517,154         1,628,453         1,628,453         1,628,453         1,628,453          1,628,453          1,628,453         1,628,453
         Total Revenues                 13,142,122     13,738,354     13,738,354     14,220,674     14,727,110     15,258,868     15,817,214     16,403,477
      EXPENDITURES
        City Administration - Dept 01             760,384            868,804            868,804            886,180            903,904             921,982             940,421            959,230
        Mayor/Council - Dept 02                210,575            210,550            210,550            214,761            219,056             223,437             227,906            232,464
        Municipal Court - Dept 04              318,374            332,256            332,256            338,901            345,679             352,593             359,645            366,837
        Finance - Dept 07                      587,050            663,129            663,129            676,392            689,919             703,718             717,792            732,148
        Police - Dept 09                    3,692,484         4,002,396         4,002,396         4,082,444         4,164,093          4,247,375          4,332,323         4,418,969
        Fire - Dept 10                      2,855,569         3,303,997         3,303,997         3,370,077         3,437,478          3,506,228          3,576,352         3,647,879
        Community Development - Dept 12             612,971            695,940            695,940            709,858            724,055             738,537             753,307            768,373

        Senior Citizen Center - Dept 16               85,300               60,850               60,850               62,067               63,308                64,575                65,866               67,183
        Library - Dept 17                      606,006            560,638            560,638            571,850            583,287             594,953             606,852            618,989
        Communications - Dept 18                   17,600               19,900               19,900               20,298               20,704                21,118                21,540               21,971
        Public Works - Dept 20              1,411,825         2,087,877         2,087,877         1,837,409         1,874,157          1,911,640          1,949,873         1,988,870
        Non Departmental - Dept 90          1,021,609         1,151,808         1,151,808         1,174,844         1,198,341          1,222,308          1,246,754         1,271,689
        Transfers Out                          331,915            331,915            331,915            275,593            275,593             275,593             275,593            275,593
         Total Expenditures             12,511,662     14,290,059     14,290,059     14,220,674     14,499,576     14,784,055     15,074,225     15,370,197

         Revenues Over (Under) Expenditures     630,460       (551,705)     (551,705)    (0)     227,534     474,813     742,989     1,033,280

         Beginning Fund Balance           4,149,173       4,779,633       4,779,633     4,227,928       4,227,928       4,455,462       4,930,275     5,673,264


         Prior Period Adjustment              -        -         -       -         -           -       -          -
         Ending Fund Balance        $     4,779,633 $     4,227,928 $     4,227,928 $     4,227,928 $     4,455,462 $      4,930,275 $      5,673,264 $     6,706,544
         Average Daily Annual Expenditures  $           34,279 $           39,151 $           39,151 $           38,961 $           39,725 $            40,504 $            41,299 $           42,110
         Days of Working Capital       139       108      108       109       112       122       137       159
         Days of Working Capital Goal = 75-100 days
      Assumptions:
         Total Tax Rate                        $0.69619
         M&O Tax Rate (for General Fund operations)  $0.48307
         I&S Tax Rate (for debt service)       $0.21312
         General Property Tax revenue growth from values and new development  5.00%  5.00%  5.00%  5.00%   5.00%
         Property Tax revenue from increased M&O tax rate (one penny generates approx. $120,000)
           One penny of M&O tax rate generates approx. $120,000 in FY2026  $120,000  $126,000  $132,300  $138,915  $145,861
         City Sales Tax revenue growth                             5.00%     5.00%     5.00%     5.00%     5.00%
         Expenditure growth in all departments                     2.00%     2.00%     2.00%     2.00%     2.00%
         All other revenues and expenditures are set numbers


                                                 CITYOFKENNEDALE.COM/FINANCE                             39