


Page 156 - CityofKellerFY26AdoptedBudget
P. 156
FIRE DEPARTMENT

            DEPARTMENT DESCRIPTION:
            The Fire Chief oversees the day to day operations of the Fire Department to ensure that it delivers the highest level of fire and
            emergency medical services in the most efficient and effective manner to secure a safe and quality environment for Keller
            residents. The department is divided into five areas: Administration, Fire & Emergency Medical Service Operations, Training, Fire
            Prevention, and the Office of Emergency Management.

            DEPARTMENT OBJECTIVES:
            1. Enhance Emergency Response Capabilities
            2. Enhance Community Outreach Programs
            3. Optimize Resource Management
            4. Strengthen Community Relationships
            5. Improve Training and Staff Development
            DEPARTMENT GOALS:
            1. Achieve an average response time of 5 minutes or less for 90% of emergency calls
            2. Conduct quarterly training sessions and ensure 100% participation from all personnel
            3. Increase public participation in fire department events (ie open houses and health fairs)
            4. Enhance equipment and maintenance schedules to reduce downtime through a proactive maintenance program
            5. Establish formal partnerships with local organizations to support fire prevention and safety initiatives
            6. Ensure fire personnel are equipped with the latest skills and knowledge by promoting a culture of continuous improvement.
            7. Establish a culture where every member feels valued, respected, and empowered to excel
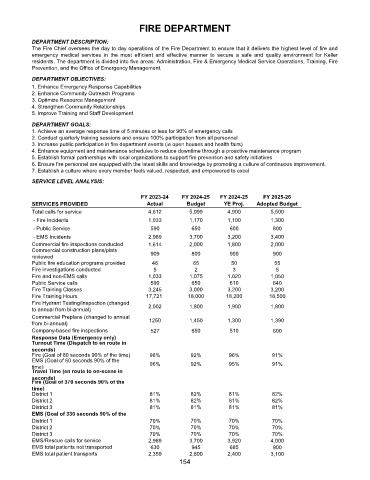
            SERVICE LEVEL ANALYSIS:

                                                FY 2023-24   FY 2024-25   FY 2024-25    FY 2025-26
            SERVICES PROVIDED                     Actual       Budget      YE Proj.   Adopted Budget
            Total calls for service               4,612         5,099       4,900          5,500
            - Fire Incidents                      1,033         1,170       1,100          1,300
            - Public Service                       590          650          600           800
            - EMS Incidents                       2,989         3,700       3,200          3,400
            Commercial fire inspections conducted  1,614        2,000       1,800          2,000
            Commercial construction plans/plats
            reviewed                               909          800          900           900
            Public fire education programs provided  46          65           50            55
            Fire investigations conducted           5            2            3             5
            Fire and non-EMS calls                1,033         1,075       1,020          1,050
            Public Service calls                   590          650          610           640
            Fire Training Classes                 3,245         3,000       3,200          3,200
            Fire Training Hours                  17,721        18,000       18,200        18,500
            Fire Hydrant Testing/Inspection (changed
            to annual from bi-annual)             2,002         1,800       1,900          1,800
            Commercial Preplans (changed to annual
            from bi-annual)                       1250          1,450       1,300          1,390
            Company-based fire inspections         527          650          510           600
            Response Data (Emergency only)
            Turnout Time (Dispatch to en route in
            seconds)
            Fire (Goal of 80 seconds 90% of the time)  96%      92%          96%           91%
            EMS (Goal of 60 seconds 90% of the
            time)                                  96%          92%          95%           91%
            Travel Time (en route to on-scene in
            seconds)
            Fire (Goal of 370 seconds 90% of the
            time)
            District 1                             81%          82%          81%           82%
            District 2                             81%          82%          81%           82%
            District 3                             81%          81%          81%           81%
            EMS (Goal of 330 seconds 90% of the
            District 1                             70%          70%          70%           70%
            District 2                             70%          70%          70%           70%
            District 3                             70%          70%          70%           70%
            EMS/Rescue calls for service          2,989         3,700       3,920          4,000
            EMS total patients not transported     630          945          685           900
            EMS total patient transports          2,359         2,800       2,400          3,100
                                                            154

