


Page 70 - Microsoft Word - FY26 Budget Book Intro
P. 70
FY 2025-26 ADOPTED BUDGET


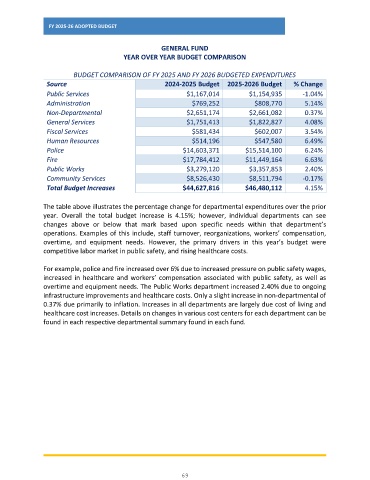
                                                      GENERAL FUND
                                          YEAR OVER YEAR BUDGET COMPARISON

                         BUDGET COMPARISON OF FY 2025 AND FY 2026 BUDGETED EXPENDITURES
                Source                                  2024-2025 Budget  2025-2026 Budget        % Change
                Public Services                                $1,167,014          $1,154,935        -1.04%
                Administration                                   $769,252            $808,770         5.14%
                Non-Departmental                               $2,651,174          $2,661,082         0.37%
                General Services                               $1,751,413          $1,822,827         4.08%
                Fiscal Services                                  $581,434            $602,007         3.54%
                Human Resources                                  $514,196            $547,580         6.49%
                Police                                        $14,603,371         $15,514,100         6.24%
                Fire                                          $17,784,412         $11,449,164         6.63%
                Public Works                                   $3,279,120          $3,357,853         2.40%
                Community Services                             $8,526,430          $8,511,794        -0.17%
                Total Budget Increases                       $44,627,816          $46,480,112         4.15%


               The table above illustrates the percentage change for departmental expenditures over the prior
               year.  Overall  the  total  budget  increase  is  4.15%;  however,  individual  departments  can  see
               changes  above  or  below  that  mark  based  upon  specific  needs  within  that  department’s
               operations. Examples of this include, staff turnover, reorganizations, workers’  compensation,
               overtime,  and  equipment  needs.  However,  the  primary  drivers  in  this  year’s  budget  were
               competitive labor market in public safety, and rising healthcare costs.

               For example, police and fire increased over 6% due to increased pressure on public safety wages,
               increased  in healthcare and  workers’  compensation  associated  with  public safety,  as  well  as
               overtime and equipment needs. The Public Works department increased 2.40% due to ongoing
               infrastructure improvements and healthcare costs. Only a slight increase in non-departmental of
               0.37% due primarily to inflation. Increases in all departments are largely due cost of living and
               healthcare cost increases. Details on changes in various cost centers for each department can be
               found in each respective departmental summary found in each fund.


                                                             69

