


Page 142 - Microsoft Word - FY26 Budget Book Intro
P. 142
FY 2025-26 ADOPTED BUDGET


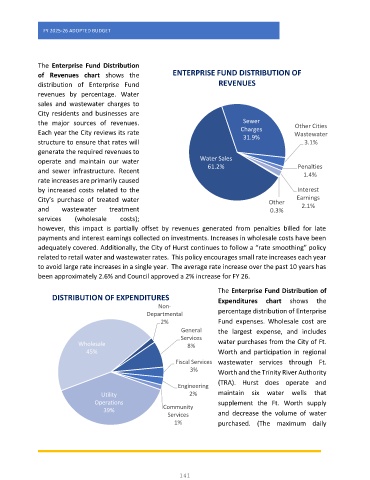
              The  Enterprise  Fund  Distribution
              of  Revenues  chart  shows  the             ENTERPRISE FUND DISTRIBUTION OF
              distribution  of  Enterprise  Fund                         REVENUES
              revenues  by  percentage.  Water
              sales  and  wastewater  charges  to
              City residents and businesses are
              the  major  sources  of  revenues.                                 Sewer             Other Cities
              Each year the City reviews its rate                                Charges          Wastewater
                                                                                 31.9%
              structure to ensure that rates will                                                     3.1%
              generate the required revenues to
              operate  and  maintain  our  water                   Water Sales
              and  sewer  infrastructure.  Recent                     61.2%                         Penalties
                                                                                                     1.4%
              rate increases are primarily caused
              by  increased  costs  related  to the                                                 Interest
              City’s  purchase  of  treated  water                                        Other    Earnings
              and    wastewater      treatment                                            0.3%       2.1%
              services    (wholesale     costs);
              however,  this  impact  is  partially  offset  by  revenues  generated  from  penalties  billed  for  late
              payments and interest earnings collected on investments. Increases in wholesale costs have been
              adequately covered. Additionally, the City of Hurst continues to follow a “rate smoothing” policy
              related to retail water and wastewater rates.  This policy encourages small rate increases each year
              to avoid large rate increases in a single year.  The average rate increase over the past 10 years has
              been approximately 2.6% and Council approved a 2% increase for FY 26.

                                                                         The  Enterprise  Fund  Distribution  of
                  DISTRIBUTION OF EXPENDITURES                           Expenditures  chart  shows  the
                                                     Non-
                                                  Departmental           percentage distribution of Enterprise
                                                      2%                 Fund  expenses.  Wholesale  cost  are
                                                             General     the  largest  expense,  and  includes
                                                             Services
                           Wholesale                           8%        water purchases from the City of  Ft.
                              45%                                        Worth  and  participation  in  regional
                                                           Fiscal Services  wastewater  services  through  Ft.
                                                                3%       Worth and the Trinity River Authority

                                                                         (TRA).  Hurst  does  operate  and
                                                            Engineering
                                   Utility                      2%       maintain  six  water  wells  that
                                Operations                               supplement  the  Ft.  Worth  supply
                                   39%                 Community
                                                         Services        and  decrease  the  volume  of  water
                                                           1%            purchased.  (The  maximum  daily


                                                            141

