
Page 60 - BudgetBookCover_FY26_Adopted.pdf
P. 60
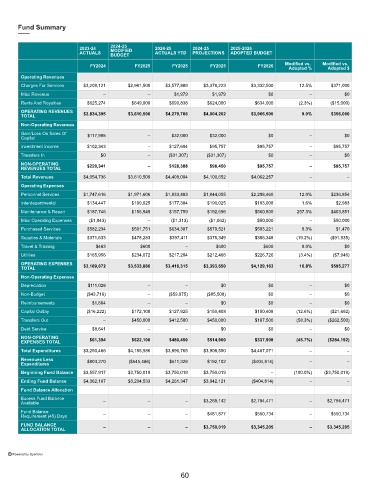
Fund Summary


                                      2024-25
                           2023-24    MODIFIED      2024-25      2024-25     2025-2026
                           ACTUALS    BUDGET        ACTUALS YTD  PROJECTIONS  ADOPTED BUDGET
                                                                                               Modified vs.   Modified vs.
                               FY2024         FY2025      FY2025       FY2025         FY2026
                                                                                                 Adopted %   Adopted $
        Operating Revenues
        Charges For Services  $3,209,121   $2,961,500   $3,577,889  $3,378,223      $3,332,500      12.5%      $371,000
        Misc Revenue               –              –        $1,979      $1,979             $0           –           $0
        Rents And Royalties   $625,274       $649,000    $699,838     $624,000       $634,000       (2.3%)    ($15,000)
        OPERATING REVENUES   $3,834,395    $3,610,500   $4,279,706  $4,004,202      $3,966,500       9.9%      $356,000
        TOTAL
        Non-Operating Revenues
        Gain/Loss On Sales Of   $117,998          –       $32,000     $32,000             $0           –           $0
        Capital
        Investment Income     $102,343            –      $127,694     $95,757         $95,757          –       $95,757
        Transfers In              $0              –      ($31,307)   ($31,307)            $0           –           $0
        NON-OPERATING
        REVENUES TOTAL        $220,341            –      $128,388     $96,450         $95,757          –       $95,757
        Total Revenues       $4,054,736    $3,610,500   $4,408,094  $4,100,652      $4,062,257         –            –
        Operating Expenses
        Personnel Services   $1,747,616    $1,971,606   $1,833,483  $1,844,055      $2,208,460      12.0%      $236,854
        Interdepartmental     $134,447       $190,025    $177,384     $190,025       $193,008        1.6%       $2,983
        Maintenance & Repair  $187,746       $156,949    $157,759     $192,696       $560,800      257.3%      $403,851
        Misc Operating Expenses  ($1,043)         –       ($1,313)    ($1,062)        $50,000          –       $50,000
        Purchased Services    $582,234       $501,751    $634,387     $579,521       $503,221        0.3%       $1,470
        Supplies & Materials  $371,633       $478,283    $397,411     $375,349       $386,348      (19.2%)    ($91,935)
        Travel & Training        $483          $600           –         $600            $600         0.0%          $0
        Utilities             $165,956       $234,672    $217,204     $212,466       $226,726       (3.4%)     ($7,946)
        OPERATING EXPENSES
        TOTAL                $3,189,072    $3,533,886   $3,416,315  $3,393,650      $4,129,163      16.8%      $595,277
        Non-Operating Expenses
        Depreciation          $111,028            –           –           $0              $0           –           $0
        Non-Budget            ($43,716)           –      ($59,975)   ($85,508)            $0           –           $0
        Reimbursements          $1,664            –           –           $0              $0           –           $0
        Capital Outlay        ($16,222)      $172,100    $127,925     $150,408       $150,408      (12.6%)    ($21,692)
        Transfers Out              –         $450,000    $412,500     $450,000       $187,500      (58.3%)    ($262,500)
        Debt Service            $8,641            –           –           $0              $0           –           $0
        NON-OPERATING          $61,394       $622,100    $480,450     $514,900       $337,908      (45.7%)    ($284,192)
        EXPENSES TOTAL
        Total Expenditures   $3,250,466    $4,155,986   $3,896,765  $3,908,550      $4,467,071         –            –
        Revenues Less         $804,270      ($545,486)   $511,328     $192,102      ($404,814)         –            –
        Expenditures
        Beginning Fund Balance  $3,557,917  $3,750,019  $3,750,019  $3,750,019             –      (100.0%)  ($3,750,019)
        Ending Fund Balance  $4,362,187    $3,204,533   $4,261,347  $3,942,121      ($404,814)         –            –
        Fund Balance Allocation
        Excess Fund Balance
        Available                  –              –           –     $3,268,142      $2,794,471         –     $2,794,471
        Fund Balance               –              –           –       $481,877       $550,734          –       $550,734
        Requirement (45) Days
        FUND BALANCE               –              –           –     $3,750,019      $3,345,205         –     $3,345,205
        ALLOCATION TOTAL


     Powered by OpenGov


                                                             60