
Page 169 - BudgetBookCover_FY26_Adopted.pdf
P. 169
Solid Waste & Recycling
Introduction
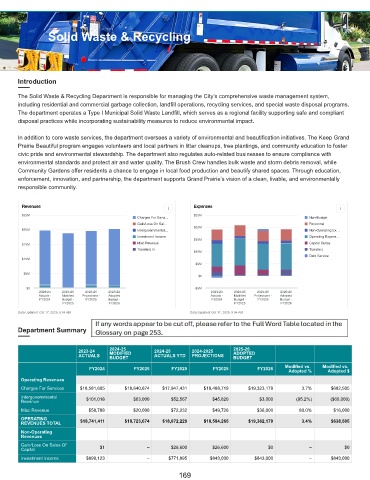
The Solid Waste & Recycling Department is responsible for managing the City’s comprehensive waste management system,
including residential and commercial garbage collection, landfill operations, recycling services, and special waste disposal programs.
The department operates a Type I Municipal Solid Waste Landfill, which serves as a regional facility supporting safe and compliant
disposal practices while incorporating sustainability measures to reduce environmental impact.
In addition to core waste services, the department oversees a variety of environmental and beautification initiatives. The Keep Grand
Prairie Beautiful program engages volunteers and local partners in litter cleanups, tree plantings, and community education to foster
civic pride and environmental stewardship. The department also regulates auto-related businesses to ensure compliance with
environmental standards and protect air and water quality. The Brush Crew handles bulk waste and storm debris removal, while
Community Gardens offer residents a chance to engage in local food production and beautify shared spaces. Through education,
enforcement, innovation, and partnership, the department supports Grand Prairie’s vision of a clean, livable, and environmentally
responsible community.
Revenues Expenses
$25M $25M
Charges For Servi… Non-Budget
Gain/Loss On Sal… Personnel
$20M
$20M Intergovernmental… Non-Operating Ex…
Investment Income Operating Expens…
$15M
$15M Misc Revenue Capital Outlay
Transfers In Transfers
$10M
Debt Service
$10M
$5M
$5M
$0
$0 -$5M
2023-24 2024-25 2024-25 2025-26 2023-24 2024-25 2024-25 2025-26
Actuals - Modified Projections - Adopted Actuals - Modified Projections - Adopted
FY2024 Budget - FY2025 Budget - FY2024 Budget - FY2025 Budget -
FY2025 FY2026 FY2025 FY2026
Data Updated: Oct 17, 2025, 5:54 AM Data Updated: Oct 17, 2025, 5:54 AM
Department Summary
2023-24 2024-25 2024-25 2024-2025 2025-26
MODIFIED
ADOPTED
ACTUALS ACTUALS YTD PROJECTIONS
BUDGET BUDGET
FY2024 FY2025 FY2025 FY2025 FY2026 Modified vs. Modified vs.
Adopted % Adopted $
Operating Revenues
Charges For Services $18,581,605 $18,640,674 $17,947,431 $18,488,719 $19,323,179 3.7% $682,505
Intergovernmental $101,018 $63,000 $52,567 $45,820 $3,000 (95.2%) ($60,000)
Revenue
Misc Revenue $58,788 $20,000 $72,232 $49,726 $36,000 80.0% $16,000
OPERATING $18,741,411 $18,723,674 $18,072,229 $18,584,265 $19,362,179 3.4% $638,505
REVENUES TOTAL
Non-Operating
Revenues
Gain/Loss On Sales Of
Capital $1 – $26,600 $26,600 $0 – $0
Investment Income $899,123 – $771,895 $843,000 $843,000 – $843,000
169