
Page 148 - BudgetBookCover_FY26_Adopted.pdf
P. 148
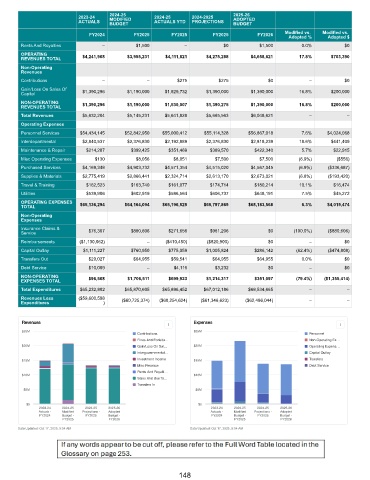
2024-25                                  2025-26
                           2023-24   MODIFIED       2024-25      2024-2025    ADOPTED
                           ACTUALS                  ACTUALS YTD  PROJECTIONS
                                     BUDGET                                   BUDGET
                               FY2024        FY2025       FY2025       FY2025         FY2026   Modified vs.   Modified vs.
                                                                                                Adopted %    Adopted $
        Rents And Royalties        –          $1,500          –            $0          $1,500        0.0%          $0
        OPERATING           $4,241,908     $3,955,231   $4,111,821   $4,275,288     $4,658,621      17.8%      $703,390
        REVENUES TOTAL
        Non-Operating
        Revenues
        Contributions              –              –         $275         $275             $0           –           $0
        Gain/Loss On Sales Of
        Capital             $1,390,296     $1,190,000   $1,529,732   $1,390,000     $1,390,000      16.8%      $200,000
        NON-OPERATING       $1,390,296     $1,190,000   $1,530,007   $1,390,275     $1,390,000      16.8%      $200,000
        REVENUES TOTAL
        Total Revenues      $5,632,204     $5,145,231   $5,641,828   $5,665,563     $6,048,621         –            –
        Operating Expenses
        Personnel Services  $54,434,145   $52,842,950  $55,000,412   $55,114,328   $56,867,018       7.6%    $4,024,068
        Interdepartmental   $2,840,537     $2,376,830   $2,192,889   $2,376,830     $2,818,239      18.6%      $441,409
        Maintenance & Repair  $214,287      $399,425     $351,469     $389,570       $422,340        5.7%      $22,915
        Misc Operating Expenses  $130         $8,056      $8,051        $7,500         $7,500       (6.9%)      ($556)
        Purchased Services  $4,169,348     $4,903,732   $4,571,354   $4,515,020     $4,567,045      (6.9%)    ($336,687)
        Supplies & Materials  $2,775,419   $2,866,441   $2,324,714   $2,613,170     $2,673,021      (6.8%)    ($193,420)
        Travel & Training     $162,523      $163,740     $161,077     $174,714       $180,214       10.1%      $16,474
        Utilities             $539,906      $602,919     $586,564     $606,737       $648,191        7.5%      $45,272
        OPERATING EXPENSES   $65,136,294  $64,164,094  $65,196,529  $65,797,869    $68,183,568       6.3%    $4,019,474
        TOTAL
        Non-Operating
        Expenses
        Insurance Claims &    $76,307       $880,606     $271,656     $961,206            $0      (100.0%)    ($880,606)
        Service
        Reimbursements     ($1,130,062)           –     ($410,450)    ($820,900)          $0           –           $0
        Capital Outlay       $1,111,227     $760,950     $775,059    $1,005,824      $286,142      (62.4%)    ($474,808)
        Transfers Out         $29,027        $64,955      $59,541      $64,955        $64,955        0.0%          $0
        Debt Service          $10,009             –        $4,116       $3,232            $0           –           $0
        NON-OPERATING         $96,508      $1,706,511    $699,923    $1,214,317      $351,097      (79.4%)  ($1,355,414)
        EXPENSES TOTAL
        Total Expenditures  $65,232,802   $65,870,605  $65,896,452  $67,012,186    $68,534,665         –            –
        Revenues Less      ($59,600,598  ($60,725,374)  ($60,254,624)  ($61,346,623)  ($62,486,044)    –            –
        Expenditures               )


        Revenues                                                 Expenses
        $25M                                                     $25M
                                              Contributions                                            Personnel
                                              Fines And Forfeitu…                                      Non-Operating Ex…
        $20M                                  Gain/Loss On Sal…  $20M                                  Operating Expens…
                                              Intergovernmental…                                       Capital Outlay
                                              Investment Income                                        Transfers
        $15M                                                     $15M
                                              Misc Revenue                                             Debt Service
                                              Rents And Royalti…
        $10M                                                     $10M
                                              Sales And Use Ta…
                                              Transfers In
         $5M                                                      $5M
          $0                                                       $0
              2023-24  2024-25  2024-25  2025-26                       2023-24  2024-25  2024-25  2025-26
                Actuals -    Modified    Projections -    Adopted        Actuals -    Modified    Projections -    Adopted
                FY2024    Budget -    FY2025    Budget -                 FY2024    Budget -    FY2025    Budget -
                        FY2025         FY2026                                    FY2025         FY2026
       Data Updated: Oct 17, 2025, 5:54 AM                      Data Updated: Oct 17, 2025, 5:54 AM


                                                            148