Page 64 - FY 2021-22 ADOPTED BUDGET
P. 64

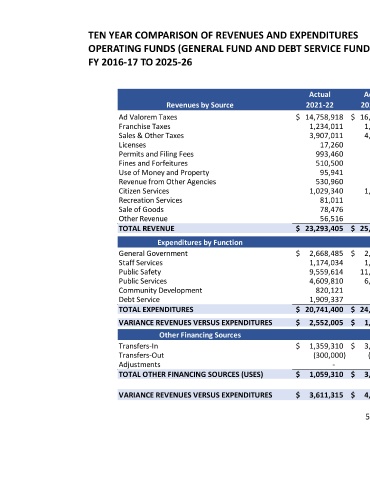
TEN YEAR COMPARISON OF REVENUES AND EXPENDITURES

                              OPERATING FUNDS (GENERAL FUND AND DEBT SERVICE FUND)

                              FY 2016-17 TO 2025-26


                                                                                                       Actual            Actual             Actual          Estimated          Budget
                                                        Revenues by Source                            2021-22           2022-23            2023-24           2024-25           2025-26             Trend
                                        Ad Valorem Taxes                                           $    14,758,918 $    16,068,225 $      17,346,295 $      17,779,284 $       18,589,771
                                        Franchise Taxes                                                1,234,011          1,291,484         1,333,688         1,227,053         1,235,000
                                        Sales & Other Taxes                                            3,907,011          4,690,258         4,379,798         4,510,100         4,510,000
                                        Licenses                                                           17,260            18,295            23,485            18,800             18,800
                                        Permits and Filing Fees                                          993,460            464,497           408,102           627,000           362,000
                                        Fines and Forfeitures                                            510,500            449,447           692,637           671,383           624,000
                                        Use of Money and Property                                          95,941           725,485         1,333,829         1,019,500           569,500
                                        Revenue from Other Agencies                                      530,960            570,886           812,459           563,000           525,000
                                        Citizen Services                                               1,029,340          1,016,045         1,178,878           865,000           865,000
                                        Recreation Services                                                81,011            77,626            95,523            75,000             75,000
                                        Sale of Goods                                                      78,476           334,377            19,393           182,670             23,250
                                        Other Revenue                                                      56,516            32,639           221,068            30,500             30,500
                                        TOTAL REVENUE                                             $    23,293,405 $     25,739,264 $      27,845,155 $      27,569,290 $       27,427,821

                                                     Expenditures by Function

                                        General Government                                         $       2,668,485 $       2,936,073 $       1,590,220 $       1,633,820 $       1,706,501
                                        Staff Services                                                 1,174,034          1,253,391         1,331,296          1,608,362          1,727,480
                                        Public Safety                                                  9,559,614        11,872,562        12,400,773        13,943,427         14,278,112
                                        Public Services                                                4,609,810          6,306,447         6,920,024          8,136,360          7,222,288
                                        Community Development                                            820,121            850,241           874,556              973,263              994,060
                                        Debt Service                                                   1,909,337            908,529         1,534,079         1,533,863         1,268,338
                                        TOTAL EXPENDITURES                                         $    20,741,400 $    24,127,242 $      24,650,948 $      27,829,095 $       27,196,779

                                        VARIANCE REVENUES VERSUS EXPENDITURES                     $       2,552,005 $       1,612,022 $       3,194,207 $         (259,805) $          231,042 $                    -
                                                      Other Financing Sources

                                        Transfers-In                                              $       1,359,310 $       3,354,465 $       2,738,639 $          640,119 $          374,444
                                        Transfers-Out                                                    (300,000)         (300,000)       (4,015,685)         (300,000)         (600,000)
                                        Adjustments                                                                      -                                                      -                        -
                                        TOTAL OTHER FINANCING SOURCES (USES)                      $       1,059,310 $       3,054,465 $     (1,277,046) $          340,119 $         (225,556)


                                        VARIANCE REVENUES VERSUS EXPENDITURES                     $       3,611,315 $       4,666,487 $       1,917,161 $             80,314 $               5,486


                                                                                                                          56
   59   60   61   62   63   64   65   66   67   68   69