
Page 140 - CityofArlingtonFY26AdoptedBudget
P. 140
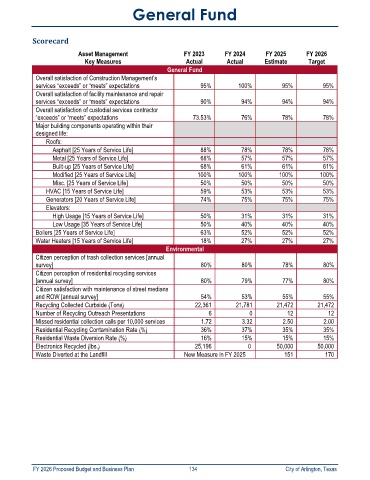
General Fund


            Scorecard
                           Asset Management                   FY 2023      FY 2024       FY 2025      FY 2026
                             Key Measures                      Actual       Actual       Estimate      Target
                                                        General Fund
             Overall satisfaction of Construction Management’s
             services “exceeds” or “meets” expectations            95%          100%          95%           95%
             Overall satisfaction of facility maintenance and repair
             services “exceeds” or “meets” expectations            90%           94%          94%           94%
             Overall satisfaction of custodial services contractor
             “exceeds” or “meets” expectations                   73.53%          76%          78%           78%
             Major building components operating within their
             designed life:
                Roofs:
                  Asphalt [25 Years of Service Life]               88%           78%          78%           78%
                  Metal [25 Years of Service Life]                 68%           57%          57%           57%
                  Built-up [25 Years of Service Life]              68%           61%          61%           61%
                  Modified [25 Years of Service Life]             100%          100%         100%          100%
                  Misc. [25 Years of Service Life]                 50%           50%          50%           50%
                HVAC [15 Years of Service Life]                    59%           53%          53%           53%
                Generators [20 Years of Service Life]              74%           75%          75%           75%
                Elevators:
                  High Usage [15 Years of Service Life]            50%           31%          31%           31%
                  Low Usage [35 Years of Service Life]             50%           40%          40%           40%
             Boilers [25 Years of Service Life]                    63%           52%          52%           52%
             Water Heaters [15 Years of Service Life]              18%           27%          27%           27%
                                                        Environmental
             Citizen perception of trash collection services [annual
             survey]                                               80%           80%          78%           80%
             Citizen perception of residential recycling services
             [annual survey]                                       80%           79%          77%           80%
             Citizen satisfaction with maintenance of street medians
             and ROW [annual survey]                               54%           53%          55%           55%
             Recycling Collected Curbside (Tons)                  22,361       21,781             21,472              21,472
             Number of Recycling Outreach Presentations               6             0           12            12
             Missed residential collection calls per 10,000 services   1.72      3.32          2.50         2.00
             Residential Recycling Contamination Rate (%)          36%           37%          35%           35%
             Residential Waste Diversion Rate (%)                  16%           15%          15%           15%
             Electronics Recycled (lbs.)                          25,196           0              50,000              50,000
             Waste Diverted at the Landfill                   New Measure in FY 2025           151           170


            FY 2026 Proposed Budget and Business Plan                                        134                                                                City of Arlington, Texas