Page 58 - CityofMansfieldFY25Budget
P. 58

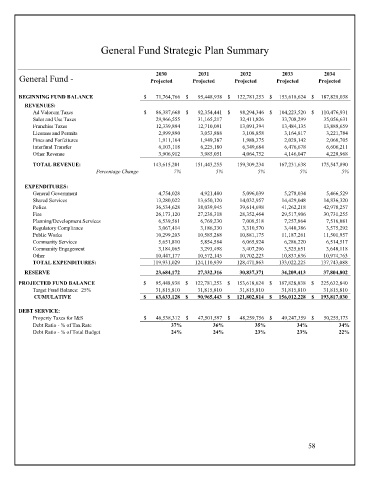
General Fund Strategic Plan Summary


                                                                                 2032
                                                                   2031
                                                     2030
                                                                                              2033
                                                                                                            2034
       General Fund -                              Projected     Projected     Projected     Projected    Projected
       BEGINNING FUND BALANCE                    $         71,764,766  $         95,448,938  $       122,781,253  $       153,618,624  $       187,828,038
         REVENUES:
            Ad Valorem Taxes                     $         86,387,668  $         92,354,441  $         98,294,346  $       104,223,520  $       110,476,931
            Sales and Use Taxes                             29,966,555             31,165,217             32,411,826             33,708,299             35,056,631
            Franchise Taxes                                 12,339,894             12,710,091             13,091,394             13,484,135             13,888,659
            Licenses and Permits                              2,999,890               3,053,888               3,108,858               3,164,817               3,221,784
            Fines and Forfeitures                             1,911,164               1,949,387               1,988,375               2,028,142               2,068,705
            Interfund Transfer                                6,103,118               6,225,180               6,349,684               6,476,678               6,606,211
            Other Revenue                                     3,906,912               3,985,051               4,064,752               4,146,047               4,228,968
            TOTAL REVENUE:                                143,615,201           151,443,255           159,309,234           167,231,638           175,547,890
                                 Percentage Change         7%           5%            5%            5%            5%

         EXPENDITURES:
            General Government                                4,754,028               4,921,480               5,096,039               5,278,034               5,466,529
            Shared Services                                 13,280,022             13,650,120             14,032,957             14,429,048             14,836,320
            Police                                          36,534,628             38,039,945             39,614,698             41,262,218             42,978,257
            Fire                                            26,173,120             27,238,318             28,352,464             29,517,906             30,731,255
            Planning/Development Services                     6,539,561               6,769,230               7,008,518               7,257,864               7,516,081
            Regulatory Compliance                             3,067,414               3,186,330               3,310,570               3,440,386               3,575,292
            Public Works                                    10,299,203             10,585,288             10,881,175             11,187,261             11,501,957
            Community Services                                5,651,810               5,854,584               6,065,924               6,286,220               6,514,517
            Community Engagement                              3,184,065               3,293,498               3,407,296               3,525,651               3,648,118
            Other                                           10,447,177             10,572,145             10,702,223             10,837,636             10,974,763
            TOTAL EXPENDITURES:                           119,931,029           124,110,939           128,471,863           133,022,225           137,743,088
         RESERVE                                            23,684,172             27,332,316             30,837,371             34,209,413             37,804,802

       PROJECTED FUND BALANCE                    $         95,448,938  $       122,781,253  $       153,618,624  $       187,828,038  $       225,632,840
            Target Fund Balance:  25%                       31,815,810             31,815,810             31,815,810             31,815,810             31,815,810
             CUMULATIVE                          $         63,633,128  $         90,965,443  $       121,802,814  $       156,012,228  $       193,817,030

       DEBT SERVICE:
            Property Taxes for I&S               $         46,538,312  $         47,501,597  $         48,259,756  $         49,247,359  $         50,255,173
            Debt Ratio - % of Tax Rate                    37%          36%           35%           34%           34%
            Debt Ratio - % of Total Budget                24%          24%           23%           23%           22%


                                                                                                       58
   53   54   55   56   57   58   59   60   61   62   63