Page 410 - Bedford-FY23-24 Budget
P. 410

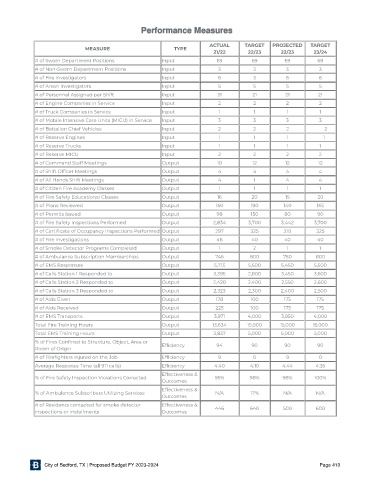
Performance Measures


                                                                      ACTUAL      TARGET   PROJECTED    TARGET
                             MEASURE                       TYPE
                                                                        21/22      22 /23     22 /23     23/24
             # of Sworn Department Positions           Input             69         69         69         69
             # of Non-Sworn Department Positions       Input             3           3          3          3
             # of Fire Investigators                   Input             6           3          6          6
             # of Arson Investigators                  Input             5           5          5          5
             # of Personnel Assigned per Shift         Input             21          21        21         21
             # of Engine Companies in Service          Input             2           2          2          2
             # of Truck Companies in Service           Input             1           1          1          1
             # of Mobile Intensive Care Units (MICU) in Service  Input   3           3          3          3
             # of Battalion Chief Vehicles             Input             2           2          2                    2
             # of Reserve Engines                      Input             1           1          1                   1
             # of Reserve Trucks                       Input             1           1          1          1
             # of Reserve MICU                         Input             2           2          2          2
             # of Command Staff Meetings               Output            10          12        12         12
             # of Shift Of cer Meetings                Output            4           4          4          4
             # of All Hands Shift Meetings             Output            4           1          4          4
             # of Citizen Fire Academy Classes         Output            1           1          1          1
             # of Fire Safety Educational Classes      Output            16         20         15         20
             # of Plans Reviewed                       Output           160         190        140        165
             # of Permits Issued                       Output            98         150        80         90
             # of Fire Safety Inspections Performed    Output           2,834      3,700      3,442      3,700
             # of Certi cate of Occupancy Inspections Performed Output  297         325        310        325
             # of Fire Investigations                  Output            46         40         40         40
             # of Smoke Detector Programs Completed    Output            1           2          1          1
             # of Ambulance Subscription Memberships   Output           745         800        750       800
             # of EMS Responses                        Output           5,713      5,500      5,450      5,500
             # of Calls Station 1 Responded to         Output           3,395      2,800      3,450      3,600
             # of Calls Station 2 Responded to         Output           2,428      2,400      2,550      2,600
             # of Calls Station 3 Responded to         Output           2,323      2,300      2,400      2,500
             # of Aids Given                           Output           178         100        175        175
             # of Aids Received                        Output           225         100        175        175
             # of EMS Transports                       Output           3,971      4,000      3,950      4,000
             Total Fire Training Hours                 Output          13,634      15,000     15,000     15,000
             Total EMS Training Hours                  Output           3,837      5,000      5,000      5,000
             % of Fires Con ned to Structure, Object, Area or
             Room of Origin                            Ef ciency         94         90         90         90
             # of Fire ghters Injured on the Job       Ef ciency         9           0          9          0
             Average Response Time (all 911 calls)     Ef ciency        4:40        4:10      4:44       4:35
                                                       Effectiveness &
             % of Fire Safety Inspection Violations Corrected           95%         98%        98%       100%
                                                       Outcomes
                                                       Effectiveness &
             % of Ambulance Subscribers Utilizing Services              N/A         17%        N/A        N/A
                                                       Outcomes
             # of Residents contacted for smoke detector  Effectiveness &  446      640        500        600
             inspections or installments               Outcomes


                City of Bedford, TX | Proposed Budget FY 2023-2024                                         Page 410
   405   406   407   408   409   410   411   412   413   414   415