
Page 398 - Bedford-FY22-23 Budget
P. 398
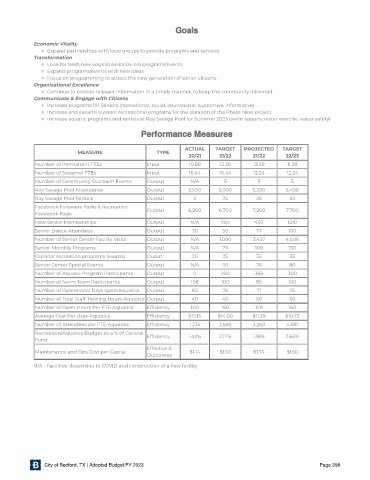
Goals

            Economic Vitality
                 Expand partnerships with local groups to provide programs and services
            Transformation
                 Look for fresh new ways to revitalize old programs/events
                 Expand programs/events with new ideas
                 Focus on programming to attract the new generation of senior citizens.
            Organizational Excellence
                 Continue to provide relevant information in a timely manner, to keep the community informed.
            Communicate & Engage with Citizens
                 Increase programs for Seniors (recreational, social, educational, supportive, informative)
                 Increase and expand outdoor recreational programs for the duration of the Phase Next project
                 Increase aquatic programs and rentals at Roy Savage Pool for Summer 2023 (swim lessons, water exercise, water safety)


                                                Performance Measures

                                                              ACTUAL    TARGET    PROJECTED   TARGET
                           MEASURE                   TYPE
                                                               20/21      21/22      21/22      22 /23

             Number of Permanent FTEs             Input         10.88     12.38      12.38      11.38

             Number of Seasonal FTEs              Input         16.44     16.44      12.24      12.24
             Number of Community Outreach Events  Output        N/A        5          5          5
             Roy Savage Pool Attendance           Output       3,500     5,000       5,200      5,400

             Roy Savage Pool Rentals              Output         2         25         36         50

             Facebook Followers Parks & Recreation  Output     6,200     6,700       7,200      7,700
             Facebook Page
             New Senior Memberships               Output        N/A       250        402        600
             Senior Dance Attendees               Output         30        50         77        100

             Number of Senior Center Facility Visits  Output    N/A       1,000      3,437     4,000

             Senior Monthly Programs              Output        N/A        70        108        150
             Outdoor recreation programs (events)  Ouput         20        25         32         35
             Senior Center Special Events         Output        N/A        50         76         80

             Number of Aquatic Program Participants  Output      0        200        369        300

             Number of Swim Team Participants     Output        106       100         85        100
             Number of Operational Days open-Aquatics  Output   60         75         71         75
             Number of Total Staff Training Hours-Aquatics Output  40      40         50         50

             Number of Open Hours Per FTE-Aquatics  Ef ciency   100       160        179        160

             Average Cost Per User-Aquatics       Ef ciency    $15.15    $14.00      $11.39    $10.73
             Number of Attendees per FTE-Aquatics  Ef ciency    1,235     2,692      3,260      4,091
             Recreation/Aquatics Budget as a % of General  Ef ciency  1.40%  2.17%   1.18%      2.63%
             Fund

                                                  Effective &
             Maintenance and Ops Cost per Capita                $1.14     $1.50      $1.74      $1.50
                                                  Outcomes

            N/A - Facilities closed due to COVID and construction of a new facility


                City of Bedford, TX | Adopted Budget FY 2023                                               Page 398