
Page 372 - Bedford-FY22-23 Budget
P. 372
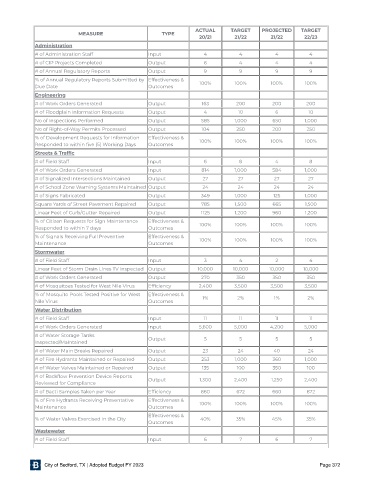
ACTUAL     TARGET     PROJECTED    TARGET
                           MEASURE                     TYPE
                                                                   20/21       21/22       21/22      22 /23

             Administration
             # of Administration Staff            Input             4           4           4          4
             # of CIP Projects Completed          Output             6          4           4          4
             # of Annual Regulatory Reports       Output             9          9           9          9
             % of Annual Regulatory Reports Submitted by Effectiveness &  100%  100%       100%       100%
             Due Date                             Outcomes

             Engineering
             # of Work Orders Generated           Output            163        200         200        200
             # of Floodplain Information Requests   Output          4           10          6          10
             No of Inspections Performed          Output            585        1,000       650        1,000
             No of Right-of-Way Permits Processed   Output          104        250         200        250
             % of Development Requests for Information  Effectiveness &  100%  100%        100%       100%
             Responded to within  ve (5) Working Days   Outcomes

             Streets & Traf{c
             # of Field Staff                     Input              6          8           4          8
             # of Work Orders Generated           Input             814        1,000       584        1,000
             # of Signalized Intersections Maintained  Output       27          27          27         27
             # of School Zone Warning Systems Maintained Output     24          24          24         24
             # of Signs Fabricated                Output            349        1,000       125        1,000
             Square Yards of Street Pavement Repaired  Output       785        1,500       665        1,500
             Linear Feet of Curb/Gutter Repaired  Output            1125       1,200       960        1,200
             % of Citizen Requests for Sign Maintenance  Effectiveness &
             Responded to within 7 days           Outcomes         100%        100%        100%       100%
             % of Signals Receiving Full Preventive  Effectiveness &  100%     100%        100%       100%
             Maintenance                          Outcomes

             Stormwater
             # of Field Staff                     Input              3          4           2          4
             Linear Feet of Storm Drain Lines TV Inspected Output  10,000     10,000      10,000     10,000
             # of Work Orders Generated           Output            270        350         350        350
             # of Mosquitoes Tested for West Nile Virus  Ef ciency  2,400      3,500       3,500      3,500
             % of Mosquito Pools Tested Positive for West  Effectiveness &
             Nile Virus                           Outcomes          1%          2%          1%         2%

             Water Distribution
             # of Field Staff                     Input             11          11          11         11
             # of Work Orders Generated           Input            5,600      5,000       4,200       5,000
             # of Water Storage Tanks             Output             5          5           5          5
             Inspected/Maintained
             # of Water Main Breaks Repaired      Output            23          24          40         24
             # of Fire Hydrants Maintained or Repaired  Output      253        1,000       360        1,000
             # of Water Valves Maintained or Repaired  Output       135        100         350         100
             # of Back ow Prevention Device Reports
             Reviewed for Compliance              Output           1,300      2,400        1,250      2,400
             # of Bacti Samples Taken per Year    Ef ciency        660         672         660        672
             % of Fire Hydrants Receiving Preventative  Effectiveness &  100%  100%        100%       100%
             Maintenance                          Outcomes
                                                  Effectiveness &
             % of Water Valves Exercised in the City               40%         35%         45%        35%
                                                  Outcomes

             Wastewater
             # of Field Staff                     Input              6          7           6          7


                City of Bedford, TX | Adopted Budget FY 2023                                               Page 372