
Page 13 - Microsoft Word - FY 2022 Adopted Budget Document
P. 13
Budget In Brief Return to Table of Contents
Return to Table of Contents
FY 2022 ADOPTED GENERAL FUND REVENUES
The City’s revenue outlook has improved significantly in recent months. The economic downturn brought about by the pandemic
was shorter in duration than originally expected, and our major revenue sources are projected to improve in FY 2022, particularly
revenues from property and sales taxes. The retail economy sharply declined beginning in the spring of last year, and projections
indicated it would take years for our sales tax revenues to rebound to the level we are projecting for the current year. We also
expected that property tax revenues, often a trailing indicator of economic stress, would decline in FY 2022 and perhaps into
FY 2023. For FY 2022, both revenues are expected to perform substantially better than the projections made during the height
of the pandemic. Assessed property values increased by 5.9% from last year, and sales taxes are projected to grow by 2.6%
above the current FY 2021 estimate of $71.51 million, which is $9.9 million above the budget for the year. The following table
provides a summary of General Fund revenues by major category for FY 2020 Actuals, FY 2021 Estimates, and FY 2022
Adopted revenues.
FY 2020 Actuals FY 2021 Estimates FY 2022 Adopted
Property Taxes $ 115,890,452 $ 107,217,494 $ 114,376,400
Sales Taxes 64,195,349 71,513,163 73,372,505
Franchise Fees 36,302,397 36,769,720 36,808,078
Service Charges 15,421,227 15,408,745 16,988,671
Fines and Forfeitures 9,449,961 7,868,145 8,370,255
Other Revenues 18,437,684 15,212,607 15,572,969
Total Revenues $ 259,697,070 $ 253,989,874 $ 265,488,878
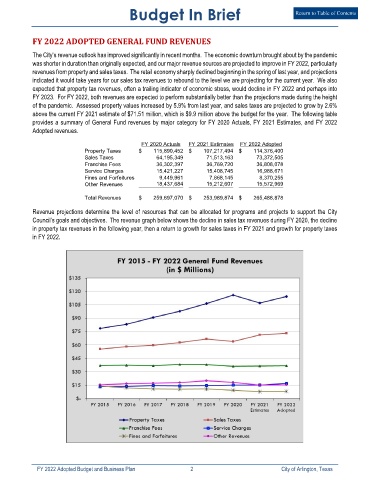
Revenue projections determine the level of resources that can be allocated for programs and projects to support the City
Council’s goals and objectives. The revenue graph below shows the decline in sales tax revenues during FY 2020, the decline
in property tax revenues in the following year, then a return to growth for sales taxes in FY 2021 and growth for property taxes
in FY 2022.
FY 2022 Adopted Budget and Business Plan 2 City of Arlington, Texas