
Page 8 - Manfield FY21 Budget
P. 8
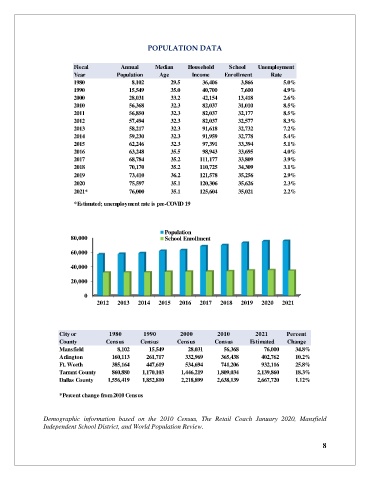
POPULATION DATA

                         Fiscal          Annual     Median     Household     School   Unemployment
                         Year           Population    Age        Income    Enrollment      Rate
                         1980                       8,102  29.5                36,406                3,866  5.0%

                         1990                       15,549  35.0                40,700                7,600  4.9%
                         2000                       28,031  33.2                42,154              13,418  2.6%

                         2010                     56,368  32.3                82,037              31,010  8.5%
                         2011                       56,850  32.3                82,037              32,177  8.5%
                         2012                       57,494  32.3                82,037              32,577  8.3%
                         2013                       58,217  32.3                91,618              32,732  7.2%
                         2014                       59,230  32.3                91,959              32,778  5.4%
                         2015                     62,246  32.3                97,391              33,394  5.1%

                         2016                       63,248  35.5                98,943              33,695  4.0%
                         2017                       68,784  35.2              111,177              33,809  3.9%
                         2018                     70,170  35.2              110,725              34,309  3.1%


                         2019                     73,410  36.2              121,578              35,256  2.9%
                         2020                       75,597  35.1              120,306              35,626  2.3%
                         2021*                      76,000  35.1              125,604              35,021  2.2%
                         *Estimated; unemployment rate is pre-COVID 19


                                                        Population
                        80,000                          School Enrollment

                        60,000

                        40,000

                        20,000

                             0
                                 2012   2013   2014  2015   2016   2017   2018   2019   2020  2021


                     City or         1980        1990        2000        2010         2021      Percent
                     County         Census     Census       Census      Census      Estimated   Change

                     Mansfield                   8,102             15,549                  28,031              56,368                 76,000  34.8%
                     Arlington               160,113           261,717                332,969            365,438                 402,762  10.2%


                     Ft. Worth             385,164           447,619              534,694            741,206                 932,116  25.8%
                     Tarrant County           860,880        1,170,103             1,446,219         1,809,034              2,139,860  18.3%
                     Dallas County          1,556,419        1,852,810           2,218,899         2,638,139              2,667,720  1.12%

                     *Percent change from 2010 Census


               Demographic  information  based  on  the  2010  Census,  The  Retail  Coach  January  2020,  Mansfield
               Independent School District, and World Population Review.


                                                                                                            8