Page 261 - Keller Budget FY21
P. 261

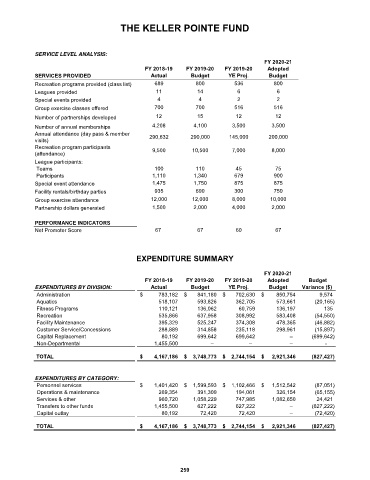
THE KELLER POINTE FUND


             SERVICE LEVEL ANALYSIS:
                                                                                        FY 2020-21
                                                 FY 2018-19    FY 2019-20   FY 2019-20    Adopted
             SERVICES PROVIDED                     Actual       Budget       YE Proj.     Budget
             Recreation programs provided (class list)  689       800          536          800
             Leagues provided                        11           14            6            6
             Special events provided                 4             4            2            2
             Group exercise classes offered         700           700          516          516
             Number of partnerships developed        12           15           12           12
             Number of annual memberships          4,208         4,100        3,500        3,500
             Annual attendance (day pass & member   290,632     290,000      145,000      200,000
             visits)
             Recreation program participants       9,500         10,500       7,000        8,000
             (attendance)
             League participants:
              Teams                                 100           110          45           75
              Participants                         1,110         1,340         679          900
             Special event attendance              1,475         1,750         875          875
             Facility rentals/birthday parties      935           690          300          750
             Group exercise attendance             12,000        12,000       8,000       10,000
             Partnership dollars generated         1,500         2,000        4,000        2,000

             PERFORMANCE INDICATORS
             Net Promoter Score                     67            67           60           67


                                              EXPENDITURE SUMMARY


                                                                                        FY 2020-21
                                                 FY 2018-19    FY 2019-20   FY 2019-20    Adopted       Budget
             EXPENDITURES BY DIVISION:             Actual       Budget       YE Proj.     Budget     Variance ($)
             Administration                    $             783,182  $         841,180  $         702,630  $          850,754                9,574
             Aquatics                                         518,107             593,826             362,705              573,661             (20,165)
             Fitness Programs                                 110,121             136,062               60,759              136,197                   135
             Recreation                                       535,866             637,958             308,992              583,408             (54,550)
             Facility Maintenance                             395,329             525,247             374,308              478,365             (46,882)
             Customer Service/Concessions                     288,889             314,858             235,118              298,961             (15,897)
             Capital Replacement                                80,192             699,642             699,642                        –           (699,642)
             Non-Departmental                              1,455,500                      –                      –                        –                    -

             TOTAL                             $         4,167,186  $     3,748,773  $     2,744,154  $       2,921,346         (827,427)


             EXPENDITURES BY CATEGORY:
             Personnel services                $          1,401,420  $      1,599,593  $      1,102,466  $       1,512,542             (87,051)
             Operations & maintenance                         269,354             391,309             194,061              326,154             (65,155)
             Services & other                                 960,720          1,058,229             747,985           1,082,650              24,421
             Transfers to other funds                      1,455,500             627,222             627,222                        –           (627,222)
             Capital outlay                                     80,192               72,420               72,420                        –             (72,420)
             TOTAL                             $         4,167,186  $     3,748,773  $     2,744,154  $       2,921,346         (827,427)


                                                             259
   256   257   258   259   260   261   262   263   264   265   266