
Page 233 - Grapevine Budget FY21
P. 233
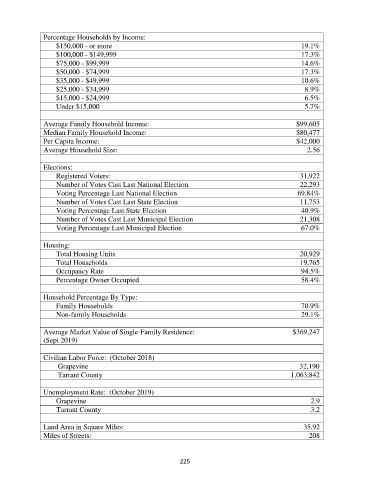
Percentage Households by Income:
                      $150,000 - or more                                                             19.1%
                      $100,000 - $149,999                                                            17.3%
                      $75,000 - $99,999                                                              14.6%
                      $50,000 - $74,999                                                              17.3%
                      $35,000 - $49,999                                                              10.6%
                      $25,000 - $34,999                                                               8.9%
                      $15,000 - $24,999                                                               6.5%
                      Under $15,000                                                                   5.7%

               Average Family Household Income:                                                    $99,605
               Median Family Household Income:                                                     $80,477
               Per Capita Income:                                                                  $42,000
               Average Household Size:                                                                 2.56

               Elections:
                      Registered Voters:                                                            31,922
                      Number of Votes Cast Last National Election                                   22,293
                      Voting Percentage Last National Election                                     69.84%
                      Number of Votes Cast Last State Election                                      11,753
                      Voting Percentage Last State Election                                          40.9%
                      Number of Votes Cast Last Municipal Election                                  21,308
                      Voting Percentage Last Municipal Election                                      67.0%

               Housing:
                      Total Housing Units                                                           20,929
                      Total Households                                                              19,765
                      Occupancy Rate                                                                 94.5%
                      Percentage Owner Occupied                                                      58.4%

               Household Percentage By Type:
                      Family Households                                                              70.9%
                      Non-family Households                                                          29.1%

               Average Market Value of Single-Family Residence:                                     $369,247
               (Sept 2019)

               Civilian Labor Force:  (October 2018)
                       Grapevine                                                                                      32,190
                       Tarrant County                                                            1,063,842

               Unemployment Rate:  (October 2019)
                      Grapevine                                                                         2.9
                    Tarrant County                                                                      3.2

               Land Area in Square Miles:                                                            35.92
               Miles of Streets:                                                                       208


                                                             225