
Page 134 - Grapevine Budget FY21
P. 134
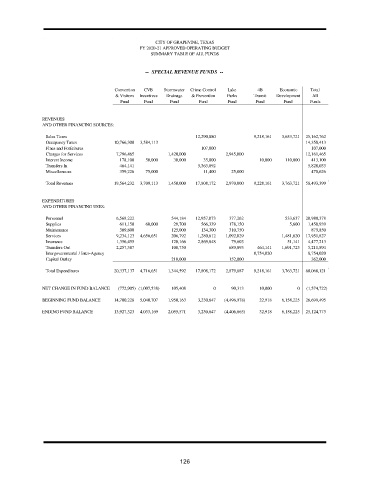
CITY OF GRAPEVINE, TEXAS
                                               FY 2020-21 APPROVED OPERATING BUDGET
                                                   SUMMARY TABLE OF ALL FUNDS


                                                 --  SPECIAL REVENUE FUNDS  --


                                       Convention  CVB  Stormwater  Crime Control  Lake  4B   Economic  Total
                                       & Visitors  Incentives  Drainage  & Prevention  Parks  Transit  Development  All
                                         Fund    Fund    Fund      Fund     Fund      Fund     Fund     Funds


               REVENUES
               AND OTHER FINANCING SOURCES:

                Sales Taxes                                       12,290,880         9,218,161  3,653,721  25,162,762
                Occupancy Taxes        10,766,300  3,584,113                                          14,350,413
                Fines and Forfeitures                               107,000                             107,000
                Charges for Services    7,796,465        1,420,000          2,945,000                 12,161,465
                Interest Income          178,100  50,000  30,000    35,000             10,000  110,000  413,100
                Transfers In             464,141                  5,363,892                            5,828,033
                Miscellaneous            359,226  75,000            11,400    25,000                    470,626
                Total Revenues         19,564,232  3,709,113  1,450,000  17,808,172  2,970,000  9,228,161  3,763,721  58,493,399


               EXPENDITURES
               AND OTHER FINANCING USES:
                Personnel               6,568,222         544,184  12,957,073  377,262         533,637  20,980,378
                Supplies                 611,150  60,000  29,700    566,339  178,150             5,600  1,450,939
                Maintenance              309,800          125,000   134,300  310,750                    879,850
                Services                9,234,123  4,656,651  206,792  1,280,612  1,092,029   1,481,620  17,951,827
                Insurance               1,356,455         120,166  2,869,848  79,603            51,141  4,477,213
                Transfers Out           2,257,387         108,750            689,893  464,141  1,691,723  5,211,894
                Intergovernmental / Inter-Agency                                     8,754,020         8,754,020
                Capital Outlay                            210,000            152,000                    362,000
                Total Expenditures     20,337,137  4,716,651  1,344,592  17,808,172  2,879,687  9,218,161  3,763,721  60,068,121


               NET CHANGE IN FUND BALANCE  (772,905) (1,007,538)  105,408  0  90,313   10,000      0  (1,574,722)
               BEGINNING FUND BALANCE  14,700,228  5,040,707  1,950,163  3,230,647  (4,496,978)  22,918  6,158,225  26,699,495

               ENDING FUND BALANCE     13,927,323  4,033,169  2,055,571  3,230,647  (4,406,665)  32,918  6,158,225  25,124,773


                                                             126