
Page 79 - Dalworthington Gardens FY21 Budget
P. 79
09/17/2020
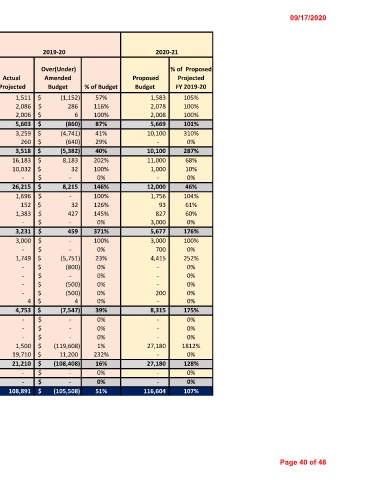
PARK & RECREATION FACILITY DEVELOPMENT
CORPORATION 2018-19 2019-20 2019-20 2019-20 2020-21
Over(Under) % of Proposed
Amended Actual Amended Proposed Projected
Account Number Account Description ACTUAL Original Budget Budget /Projected Budget % of Budget Budget FY 2019-20
40.6500 Utilities:Electricity 2,548 2,663 2,663 $ 1,511 $ (1,152) 57% 1,583 105%
40.6510 Utilities-Telephone 2,491 1,800 1,800 $ 2,086 $ 286 116% 2,078 100%
40.6515 Utilities-Water & Sewer 2,117 2,000 2,000 $ 2,006 $ 6 100% 2,008 100%
Total Utilities 7,156 6,463 6,463 $ 5,603 $ (860) 87% 5,669 101%
40.6810 Maintenance: Blgs/Ground/Park 21,691 8,000 8,000 $ 3,259 $ (4,741) 41% 10,100 310%
40.6825 Maintenance: Equipment 1,160 1,000 900 $ 260 $ (640) 29% - 0%
Total Maintenance 22,852 9,000 8,900 $ 3,518 $ (5,382) 40% 10,100 287%
40.7015 Consultants:Legal-Regular 6,572 8,000 8,000 $ 16,183 $ 8,183 202% 11,000 68%
40.7030 Consultants:Engineer-Regular - 10,000 10,000 $ 10,032 $ 32 100% 1,000 10%
40.7095 Consultants:Other - - - $ - $ - 0% - 0%
Total Consultants 6,572 18,000 18,000 $ 26,215 $ 8,215 146% 12,000 46%
40.7300 Contractual:Computer 1,230 1,696 1,696 $ 1,696 $ - 100% 1,756 104%
40.7505 Contractual:Liability Insuranc 120 120 120 $ 152 $ 32 126% 93 61%
40.7510 Contractual:Worker's Compensat 1,008 956 956 $ 1,383 $ 427 145% 827 60%
40.7620 Contractual:TRA Effluent Fee - 3,000 - $ - $ - 0% 3,000 0%
Total Contractual 2,359 5,772 2,772 $ 3,231 $ 459 371% 5,677 176%
40.8010 Other: Membership/Dues 3,000 3,000 3,000 $ 3,000 $ - 100% 3,000 100%
40.8020 Other: Meetings - - - $ - $ - 0% 700 0%
40.8022 Other: Special Events 2,367 7,500 7,500 $ 1,749 $ (5,751) 23% 4,415 252%
40.8035 Other: Marketing/Advertising - 800 800 $ - $ (800) 0% - 0%
40.8051 Other: Scout Projects 57 - - $ - $ - 0% - 0%
40.8052 Other: Historical Committee - 500 500 $ - $ (500) 0% - 0%
40.8070 Other: Misc - 500 500 $ - $ (500) 0% 200 0%
40.8085 Other:Interest on Cash Deficit 40 - - $ 4 $ 4 0% - 0%
Total Other 5,465 12,300 12,300 $ 4,753 $ (7,547) 39% 8,315 175%
40.9510 Capital Outlay:P&R FDC Street - - - $ - $ - 0% - 0%
40.9100 Capital Outlay:Vehicle 10,000 - - $ - $ - 0% - 0%
40.9305 Capital Outlay:Alarm Monitor 18,398 - - $ - $ - 0% - 0%
40.9320 Capital Outlay:Park Improvements 1,000 121,108 121,108 $ 1,500 $ (119,608) 1% 27,180 1812%
40.9350 Capital Outlay:Equipment - - 8,510 $ 19,710 $ 11,200 232% - 0%
Total Capital Outlay 29,398 121,108 129,618 $ 21,210 $ (108,408) 16% 27,180 128%
40.9700 Transfer Out - - - $ - $ - 0% - 0%
Total Other Uses - - - $ - $ - 0% - 0%
TOTAL EXPENSES 119,356 208,889 214,400 $ 108,891 $ (105,508) 51% 116,604 107%
Page 40 of 48