
Page 262 - Colleyville FY21 Budget
P. 262
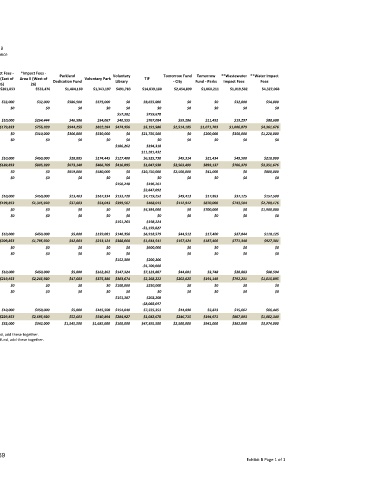
**Water Impact   Fees  $4,327,068  $54,000  0  $  $88,608  $4,361,676  $1,220,000  0  $  $210,000  $3,351,676  $800,000  0  $  $157,500  $2,709,176  $1,900,000  0  $  $118,125  $927,301  $0  0  $  $88,594  $1,015,895  $0  0  $  $66,445  $1,082,340  $3,974,000  Exhibit B Page 1 of 1


                          **Wastewater   Impact Fees  $1,019,582  $32,000  0  $  $19,297  $1,006,879  $350,000  0  $  $49,500  $706,379  $0  0  $  $37,125  $743,504  $0  0  $  $27,844  $771,348  $0  0  $  $20,883  $792,231  $0  0  $  $15,662  $807,893  $382,000


                          Tomorrow   Fund ‐ Parks  $1,060,211  $0  0  $  $11,492  $1,071,703  $200,000  0  $  $21,434  $893,137  $41,000  0  $  $17,863  $870,000  $700,000  0  $  $17,400  $187,400  $0  0  $  $3,748  $191,148  $0  0  $  $3,823  $194,971  $941,000


                          Tomorrow Fund   ‐ City  $2,454,899  $0  0  $  $59,286  $2,514,185  $0  0  $  $49,314  $2,563,499  $2,500,000  0  $  $49,413  $112,912  $0  0  $  $44,512  $157,424  $0  0  $  $44,601  $202,025  $0  0  $  $44,690  $246,715  $2,500,000


                               $14,839,180  $9,655,000  $759,678  $767,084  $5,191,586  $21,756,500  $194,318  $11,281,432  $6,525,730  $1,047,930  $10,750,000  $196,261  $2,647,092  $7,719,252  $468,013  $4,384,000  $198,224  ‐$1,159,827  $6,918,579  $1,644,541  $600,000  $200,206  ‐$5,700,000  $7,123,887  $2,268,222  $250,000  $202,208  ‐$8,068,697  $7,335,353  $1,082,670  $47,395,500

                           TIF       0  $       0  $        0  $         0  $                     0  $

                          Voluntary   Library  $491,783  $0  0  $  $57,382  $40,555  $474,956  $0  0  $  $186,262  $127,400  $416,095  $0  0  $  $150,248  $133,720  $399,567  $0  0  $  $151,263  $140,356  $388,660  $0  0  $  $152,309  $147,324  $383,674  $100,000  0  $  $153,387  $154,640  $284,927  $100,000


                           Voluntary Park  $1,343,197  $575,000  0  $  $54,067  $822,264  $530,000  0  $  $174,445  $466,709  $580,000  0  $  $167,334  $54,043  $0  0  $  $159,081  $213,124  $0  0  $  $162,262  $375,386  $0  0  $  $165,508  $540,894  $1,685,000


                          Parkland   Dedication Fund  $1,484,169  $586,500  0  $  $46,586  $944,255  $300,000  0  $  $28,885  $673,140  $659,000  0  $  $23,463  $37,603  $0  0  $  $5,000  $42,603  $0  0  $  $5,000  $47,603  $0  0  $  $5,000  $52,603  $1,545,500


                          *Impact Fees ‐   Area II (West of   26)  $533,476  $32,000  0  $  $254,444  $755,920  $310,000  0  $  $450,000  $895,920  $0  0  $  $450,000  $1,345,920  $0  0  $  $450,000  $1,795,920  $0  0  $  $450,000  $2,245,920  $0  0  $  $450,000  $2,695,920  $342,000


                 Exhibit B  Fund Balance  *Impact Fees ‐   Area I (East of   26)  $201,853  $0  $32,000  $0  0  $  $10,000  $0  $179,853  $0  $0  $0  $10,000  $0  $189,853  $0  $0  $0  $10,000  $0  $199,853  $0  $0  $0  $0  $0  $10,000  $0  $209,853  $0  $0  $0  $0  $0  $10,000  $0  $219,853  $0  $0  $0  $0  $0  $10,000  $0  $229,853  $0  $32,000  259


                           *FHA/TxDOT  0  $  $3,077,000  $3,077,000  $1,222,302  $1,222,302                 $4,299,302


                           Drainage Fund  $1,810,127  $305,800  $200,000  $20,000  $1,724,327  $1,975,000  $200,000  $8,622  ‐$42,051  $300,000  $200,000  $0  ‐$142,051  $300,000  $200,000  $0  ‐$242,051  $300,000  $200,000  $0  ‐$342,051  $300,000  $200,000  $0  ‐$442,051  $3,480,800


                          CEDC (Parks,   Trails & Libraries)  $4,206,052  $714,500  $0  $845,263  $799,438  $3,445,727  $685,000  $0  $3,921,570  $2,287,391  $1,126,548  $875,000  $0  $1,543,743  $2,287,491  $995,296  $1,300,000  $0  $1,568,445  $2,338,901  $465,752  $375,000  $0  $1,591,974  $2,381,077  $879,855  $300,000  $0  $1,021,821  $2,413,367  $1,971,401  $4,249,500


                           **Utility Fund  $6,343,096  $1,790,200  $1,330,000  $78,323  $5,961,219  $2,370,000  $531,100  $546,941  $4,669,260  $4,950,000  $531,100  $794,326  $1,044,686  $2,000,000  $531,100  $1,038,457  $614,243  $1,900,000  $531,100  $1,301,597  $546,940  $1,200,000  $531,100  $1,573,732  $1,451,772  $14,210,200 *These revenue sources are located in the Utility Capital Fund, but for the purposes of this report we've broken them out. To get actual projected balance of that fund, add these together. **These revenue sources are located in the General Capital Fund, but for the purposes of this report we've br


                          Capital Projects   Fund  $16,999,238  $1,240,500  $1,395,305  $0  $17,154,043  $7,480,000  $500,000  ‐$10,381,432  $2,244,834  $2,037,445  $4,350,000  $500,000  ‐$1,747,092  $2,211,191  ‐$1,348,456  $4,575,000  $500,000  $1,259,827  $2,202,895  ‐$1,960,734  $4,075,000  $500,000  $4,800,000  $1,702,598  $966,864  $4,575,000  $500,000  $8,068,697  $1,709,365  $6,669,926  $26,295,500


                           Total Project Cost  $15,017,500  $40,253,500  $28,527,302  $15,159,000  $7,250,000  $6,725,000  $112,932,302


                               Estimated 8/1/2020 Available Balances Projects under contract or in progress  (+) Year‐end surplus contributions (‐) Costs not included in project list (+) FY21 Budgeted Contribution Estimated 10/1/2020 Available Balance  (+) Year‐end surplus contributions  (‐/+) Transfers in/out (+) FY22 Budgeted Contribution Estimated 10/1/2021 Available Balance  (+) Year‐end surplus contributions  (‐/+) Transfers in/out (+) FY23 Budgeted Contribution Estimated 10/1/2022 Available Balance  (+) Year‐end surplus contributions  (‐/+) Transfers in/out (+) FY24 Budgeted Contribution Estimated 10/1/2023 Available B


                           Title   Sum Of Total Project Cost:  Sum Of Total Project Cost:  (‐) Operational Costs not included in project list  Sum Of Total Project Cost:  (‐) Operational Costs not included in project list  Sum Of Total Project Cost:  (‐) Operational Costs not included in project list  Sum Of Total Project Cost:  (‐) Operational Costs not included in project list  Sum Of Total Project Cost:  (‐) Operational Costs not included in project list  Total Project Cost Grand Total Sum:


                           Year  2020       2021        2022         2023        2024         2025                                                       9/8/2020  1:47 PM