Page 189 - Colleyville FY21 Budget
P. 189

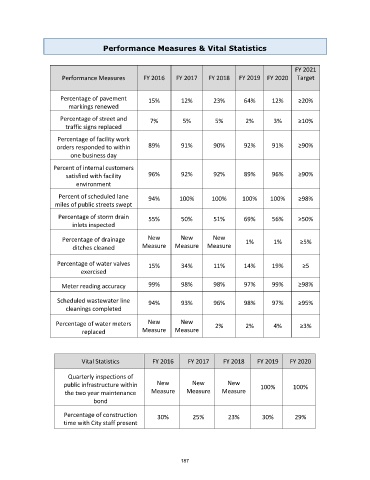
Performance Measures & Vital Statistics

                                                                                                   FY 2021
                      Performance Measures      FY 2016    FY 2017    FY 2018   FY 2019  FY 2020   Target


                     Percentage of pavement       15%        12%        23%       64%      12%      ≥20%
                        markings renewed

                     Percentage of street and      7%        5%         5%        2%        3%      ≥10%
                       traffic signs replaced
                    Percentage of facility work
                    orders responded to within    89%        91%        90%       92%      91%      ≥90%
                        one business day
                   Percent of internal customers
                       satisfied with facility    96%        92%        92%       89%      96%      ≥90%
                          environment

                    Percent of scheduled lane     94%       100%       100%      100%     100%      ≥98%
                   miles of public streets swept
                    Percentage of storm drain     55%        50%        51%       69%      56%      ≥50%
                         inlets inspected

                      Percentage of drainage      New        New       New        1%        1%      ≥5%
                         ditches cleaned        Measure    Measure    Measure


                    Percentage of water valves    15%        34%        11%       14%      19%       ≥5
                            exercised

                     Meter reading accuracy       99%        98%        98%       97%      99%      ≥98%

                    Scheduled wastewater line     94%        93%        96%       98%      97%      ≥95%
                       cleanings completed

                    Percentage of water meters    New        New        2%        2%        4%      ≥3%
                            replaced            Measure    Measure


                            Vital Statistics       FY 2016     FY 2017     FY 2018    FY 2019    FY 2020

                        Quarterly inspections of
                      public infrastructure within   New         New        New        100%       100%
                       the two year maintenance    Measure     Measure    Measure
                                bond

                      Percentage of construction     30%         25%        23%         30%        29%
                      time with City staff present


                                                             187
   184   185   186   187   188   189   190   191   192   193   194