
Page 134 - Colleyville FY21 Budget
P. 134
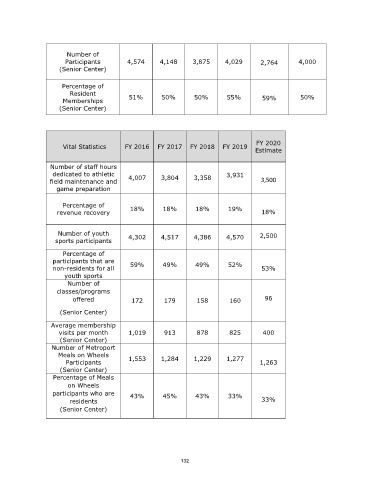
Number of
                       Participants        4,574      4,148      3,875      4,029      2,764        4,000
                     (Senior Center)

                      Percentage of
                        Resident
                      Memberships           51%       50%        50%        55%         59%         50%
                     (Senior Center)


                                                                                      FY 2020
                      Vital Statistics    FY 2016   FY 2017  FY 2018  FY 2019
                                                                                     Estimate

                  Number of staff hours
                  dedicated to athletic                                     3,931
                  field maintenance and     4,007     3,804      3,358                 3,500
                    game preparation

                      Percentage of
                    revenue recovery        18%        18%        18%       19%         18%


                    Number of youth                                                    2,500
                   sports participants      4,302     4,517      4,386      4,570

                      Percentage of
                  participants that are     59%        49%        49%       52%
                  non-residents for all                                                 53%
                      youth sports
                       Number of
                    classes/programs
                         offered            172        179        158        160         96

                     (Senior Center)
                  Average membership
                    visits per month        1,019      913        878        825        400
                     (Senior Center)
                  Number of Metroport
                    Meals on Wheels
                       Participants         1,553     1,284      1,229      1,277      1,263
                     (Senior Center)
                   Percentage of Meals
                       on Wheels
                  participants who are      43%        45%        43%       33%
                        residents                                                       33%
                     (Senior Center)


                                                             132