
Page 31 - City of Bedford FY21 Budget
P. 31
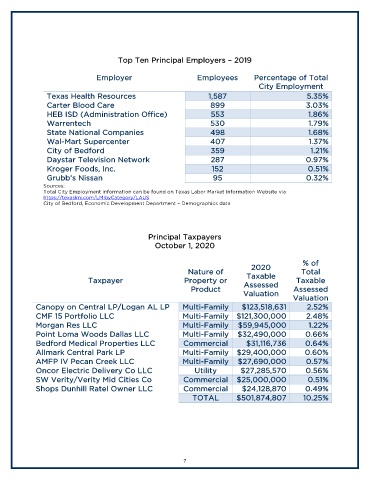
Top Ten Principal Employers – 2019

                                 Employer                         Employees          Percentage of Total
                                                                                       City Employment
                 Texas Health Resources                               1,587                            5.35%
                 Carter Blood Care                                     899                            3.03%
                 HEB ISD (Administration Office)                       553                             1.86%
                 Warrentech                                            530                             1.79%
                 State National Companies                              498                             1.68%
                 Wal-Mart Supercenter                                  407                             1.37%
                 City of Bedford                                       359                              1.21%
                 Daystar Television Network                            287                            0.97%
                 Kroger Foods, Inc.                                    152                             0.51%
                 Grubb’s Nissan                                        95                             0.32%
               Sources:
               Total City Employment information can be found on Texas Labor Market Information Website via
               https://texaslmi.com/LMIbyCategory/LAUS
               City of Bedford, Economic Development Department – Demographics data


                                                  Principal Taxpayers
                                                    October 1, 2020

                                                                                                     % of
                                                                                    2020
                                                               Nature of                             Total
                                                                                   Taxable
                              Taxpayer                        Property or         Assessed         Taxable
                                                                Product                           Assessed
                                                                                  Valuation
                                                                                                  Valuation
             Canopy on Central LP/Logan AL LP                Multi-Family        $123,518,631          2.52%
             CMF 15 Portfolio LLC                            Multi-Family  $121,300,000               2.48%
             Morgan Res LLC                                  Multi-Family  $59,945,000                 1.22%
             Point Loma Woods Dallas LLC                     Multi-Family  $32,490,000                0.66%
             Bedford Medical Properties LLC                   Commercial           $31,116,736        0.64%
             Allmark Central Park LP                         Multi-Family  $29,400,000                0.60%
             AMFP IV Pecan Creek LLC                         Multi-Family  $27,690,000                0.57%
             Oncor Electric Delivery Co LLC                      Utility         $27,285,570          0.56%
             SW Verity/Verity Mid Cities Co                   Commercial  $25,000,000                  0.51%
             Shops Dunhill Ratel Owner LLC                    Commercial         $24,128,870          0.49%
                                                                 TOTAL         $501,874,807          10.25%


                                                              7