
Page 310 - FY 2009 Proposed Budget
P. 310
Appendices
Contents
Contents
Table of Contents
of
Table
Table
of
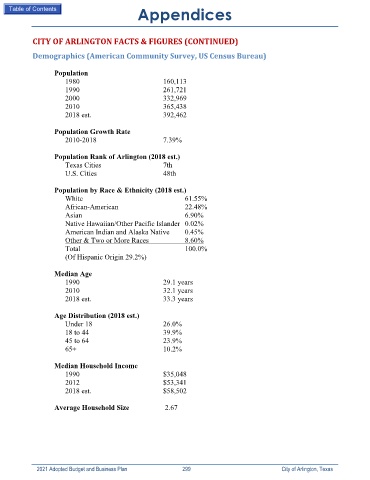
CITY OF ARLINGTON FACTS & FIGURES (CONTINUED)
Demographics (American Community Survey, US Census Bureau)
Population
1980 160,113
1990 261,721
2000 332,969
2010 365,438
2018 est. 392,462
Population Growth Rate
2010-2018 7.39%
Population Rank of Arlington (2018 est.)
Texas Cities 7th
U.S. Cities 48th
Population by Race & Ethnicity (2018 est.)
White 61.55%
African-American 22.48%
Asian 6.90%
Native Hawaiian/Other Pacific Islander 0.02%
American Indian and Alaska Native 0.45%
Other & Two or More Races 8.60%
Total 100.0%
(Of Hispanic Origin 29.2%)
Median Age
1990 29.1 years
2010 32.1 years
2018 est. 33.3 years
Age Distribution (2018 est.)
Under 18 26.0%
18 to 44 39.9%
45 to 64 23.9%
65+ 10.2%
Median Household Income
1990 $35,048
2012 $53,341
2018 est. $58,502
Average Household Size 2.67
2021 Adopted Budget and Business Plan 299 City of Arlington, Texas