Page 96 - City of Westlake FY20 Budget
P. 96

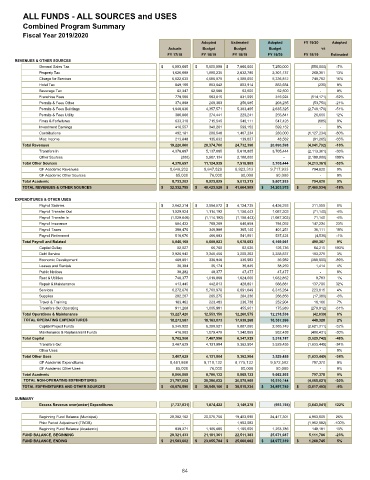
ALL FUNDS - ALL SOURCES and USES

         Combined Program Summary
         Fiscal Year 2019/2020
                                                                    Adopted   Estimated   Adopted     FY 19/20  Adopted
                                                         Actuals    Budget    Budget      Budget           vs
                                                        FY 17/18    FY 18/19  FY 18/19    FY 19/20    FY 18/19  Estimated
      REVENUES & OTHER SOURCES
              General Sales Tax                       $          6,003,605  $          5,600,000  $          7,800,000              7,250,000                 (550,000)  -7%
              Property Tax                                        1,626,698              1,990,235              2,032,786              2,301,137                    268,351  13%
              Charge for Services                                 5,522,635              4,585,075              4,588,050              5,336,812                    748,762  16%
              Hotel Tax                                              849,166                 853,642                 853,914                 853,684                        (230)  0%
              Beverage Tax                                             62,347                   62,500                   62,500                   62,500                          -  0%
              Franchise Fees                                         779,506                 983,815                 831,095                 316,924                 (514,171)  -62%
              Permits & Fees Other                                   374,898                 269,303                 256,985                 203,235                   (53,750)  -21%
              Permits & Fees Buildings                            1,940,036              4,357,571              5,383,495              2,635,325              (2,748,170)  -51%
              Permits & Fees Utility                                 306,066                 274,441                 229,241                 255,841                      26,600  12%
              Fines & Forfeitures                                    633,318                 715,545                 548,111                 547,426                        (685)  0%
              Investment Earnings                                    416,557                 340,261                 599,152                 599,152                          -  0%
              Contributions                                          492,181                 206,540              1,407,234                 280,000              (1,127,234)  -80%
              Misc Income                                            213,848                 135,832                 139,827                   48,562                   (91,265)  -65%
        Total Revenues                                          19,220,860            20,374,760            24,732,390            20,690,598              (4,041,792)  -16%
              Transfers In                                        4,378,897              5,137,805              5,818,805              3,705,444              (2,113,361)  -36%
              Other Sources                                                (200)              5,987,134              2,100,000                         -              (2,100,000)  100%
        Total Other Sources                                       4,378,697            11,124,939              7,918,805              3,705,444              (4,213,361)  -53%
              GF Academic Revenues                             8,648,202           8,847,829           8,923,313           9,717,933                    794,620  9%
              GF Academic Other Sources                             85,000                76,000                90,000                90,000                          -  0%
        Total Academic                                            8,733,202              8,923,829              9,013,313              9,807,933                    794,620  9%
        TOTAL REVENUES & OTHER SOURCES                $        32,332,759  $        40,423,528  $        41,664,509  $        34,203,975  $          (7,460,534)  -18%

      EXPENDITURES & OTHER USES

              Payroll Salaries                        $          3,642,314  $          3,994,572  $          4,124,735              4,436,293                  311,559  8%
              Payroll Transfer Out                                1,029,924              1,114,192              1,158,443              1,087,303                   (71,140)  -6%
              Payroll Transfer In                                (1,029,640)             (1,114,192)            (1,158,443)             (1,087,303)                      71,140  -6%
              Payroll Insurance                                      584,422                 780,269                 646,858                 794,092                  147,234  23%

              Payroll Taxes                                          308,470                 348,989                 365,140                 401,251                    36,111  10%

              Payroll Retirement                                     510,676                 486,093                 541,961                 537,424                     (4,536)  -1%
        Total Payroll and Related                                 5,046,168              5,609,923              5,678,693              6,169,061                  490,367  9%

              Capital Outlay                                           52,527                   66,765                   62,525                 126,735                      64,210  103%
              Debt Service                                        3,926,942              3,345,456              3,255,262              3,358,537                    103,275  3%
              Economic Development                                   469,851                 336,940                 336,982                   36,982                 (300,000)  -89%
              Leases and Rentals                                       36,384                   35,174                   36,845                   38,259                      1,414  4%

              Public Notices                                           38,282                   48,377                   47,477                   47,477                          -  0%
              Rent & Utilities                                       740,377              1,019,069              1,024,069              1,032,852                      8,783  1%

              Repair & Maintenance                                   413,445                 442,813                 428,891                 566,681                    137,790  32%
              Services                                            6,272,676              5,763,978              6,091,649              6,315,264                    223,615  4%
              Supplies                                               202,207                 265,275                 284,236                 266,856                   (17,380)  -6%
              Travel & Training                                      163,462                 223,403                 236,738                 252,904                    16,166  7%

              Transfers Out Operating                                911,268              1,005,901                 455,901                 175,989                 (279,912)  -61%
        Total Operations & Maintenance                          13,227,420            12,553,150            12,260,575            12,218,536                   (42,039)  0%

         TOTAL OPERATING EXPENDITURES                           18,273,587            18,163,073            17,939,268            18,387,596                  448,328  2%
              Capital Project Funds                               9,345,922              6,388,521              5,007,060              2,385,749              (2,621,311)  -52%
              Maintenance & Replacement Funds                        416,583              1,079,475              1,340,869                 932,438                 (408,431)  -30%
        Total Capital                                             9,762,506              7,467,996              6,347,929              3,318,187              (3,029,742)  -48%
              Transfers Out                                       3,467,629              4,131,904              5,362,904              3,529,455              (1,833,449)  -34%
              Other Uses                                                     -                         -                         -                         -                          -  0%
        Total Other Uses                                          3,467,629              4,131,904              5,362,904              3,529,455              (1,833,449)  -34%
              GF Academic Expenditures                         8,481,868           8,710,132           8,775,132           9,572,502                    797,370  9%
              GF Academic Other Uses                                85,000                76,000                90,000                90,000                          -  0%
        Total Academic                                            8,566,868              8,786,132              8,865,132              9,662,502                    797,370  9%
         TOTAL NON-OPERATING EXPENDITURES                       21,797,002            20,386,032            20,575,965            16,510,144              (4,065,821)  -20%
        TOTAL EXPENDITURES AND OTHER SOURCES          $        40,070,590  $        38,549,106  $        38,515,234  $        34,897,740  $          (3,617,493)  -9%
      SUMMARY
              Excess Revenus over(under) Expenditures             (7,737,831)              1,874,422              3,149,278                (693,765)              (3,843,041)  122%

              Beginning Fund Balance (Municipal)                28,382,162            20,075,756            19,453,696            24,417,301                4,963,605  26%
              Prior Period Adjustment (TWDB)                                 -                         -              1,952,082                         -              (1,952,082)  -100%
              Beginning Fund Balance (Academic)                      939,271              1,105,605              1,105,605              1,253,786                  148,181  13%

        FUND BALANCE, BEGINNING                                 29,321,433            21,181,361            22,511,383            25,671,087                5,111,786  -23%
        FUND BALANCE, ENDING                          $        21,583,602  $        23,055,784  $        25,660,662  $        24,977,319  $           1,268,745  5%


                                                             84
   91   92   93   94   95   96   97   98   99   100   101