Page 340 - City of Westlake FY20 Budget
P. 340

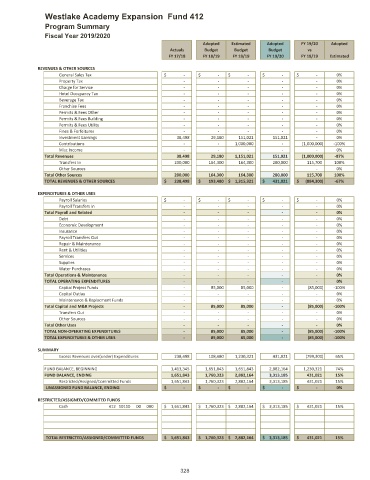
Westlake Academy Expansion  Fund 412

                Program Summary
                Fiscal Year 2019/2020
                                                                    Adopted   Estimated  Adopted     FY 19/20  Adopted
                                                         Actuals     Budget    Budget     Budget       vs
                                                         FY 17/18   FY 18/19  FY 18/19   FY 19/20    FY 18/19  Estimated

              REVENUES & OTHER SOURCES
                     General Sales Tax                 $                  ‐    $                  ‐    $                    ‐  $                  ‐    $                    ‐  0%
                     Property Tax                                           ‐                       ‐                       ‐                       ‐                       ‐  0%
                     Charge for Service                                     ‐                       ‐                       ‐                       ‐                       ‐  0%
                     Hotel Occupancy Tax                                    ‐                       ‐                       ‐                       ‐                       ‐  0%
                     Beverage Tax                                           ‐                       ‐                       ‐                       ‐                       ‐  0%
                     Franchise Fees                                         ‐                       ‐                       ‐                       ‐                       ‐  0%
                     Permits & Fees Other                                   ‐                       ‐                       ‐                       ‐                       ‐  0%
                     Permits & Fees Building                                ‐                       ‐                       ‐                       ‐                       ‐  0%
                     Permits & Fees Utility                                 ‐                       ‐                       ‐                       ‐                       ‐  0%
                     Fines & Forfeitures                                    ‐                       ‐                       ‐                       ‐                       ‐  0%
                     Investment Earnings                             38,498                29,180             151,021              151,021                       ‐  0%
                     Contributions                                          ‐                       ‐          1,000,000                       ‐         (1,000,000)  ‐100%
                     Misc Income                                            ‐                       ‐                       ‐                       ‐                       ‐  0%
                Total Revenues                                       38,498                29,180         1,151,021              151,021         (1,000,000)  ‐87%
                     Transfers In                                  200,000              164,300             164,300              280,000              115,700  100%
                     Other Sources                                          ‐                       ‐                       ‐                       ‐                       ‐  0%
                Total Other Sources                                200,000              164,300             164,300              280,000              115,700  100%
                TOTAL REVENUES & OTHER SOURCES         $         238,498  $         193,480 $      1,315,321  $         431,021  $        (884,300)  ‐67%

              EXPENDITURES & OTHER USES
                     Payroll Salaries                  $                    ‐  $                  ‐    $                  ‐    $                  ‐    $                    ‐  0%
                     Payroll Transfers In                                   ‐                       ‐                       ‐                       ‐                       ‐  0%
                Total Payroll and Related                                   ‐                      ‐                        ‐                        ‐                          ‐  0%
                     Debt                                                   ‐                       ‐                       ‐                       ‐                       ‐  0%
                     Economic Development                                   ‐                       ‐                       ‐                       ‐                       ‐  0%
                     Insurance                                              ‐                       ‐                       ‐                       ‐                       ‐  0%
                     Payroll Transfers Out                                  ‐                       ‐                       ‐                       ‐                       ‐  0%
                     Repair & Maintenance                                   ‐                       ‐                       ‐                       ‐                       ‐  0%
                     Rent & Utilities                                       ‐                       ‐                       ‐                       ‐                       ‐  0%
                     Services                                               ‐                       ‐                       ‐                       ‐                       ‐  0%
                     Supplies                                               ‐                       ‐                       ‐                       ‐                       ‐  0%
                     Water Purchases                                        ‐                       ‐                       ‐                       ‐                       ‐  0%
                Total Operations & Maintenance                              ‐                        ‐                        ‐                        ‐                      ‐    0%
                TOTAL OPERATING EXPENDITURES                                ‐                      ‐                        ‐                        ‐                        ‐    0%
                     Capital Project Funds                                  ‐                85,000               85,000                       ‐               (85,000)  ‐100%
                     Capital Outlay                                         ‐                       ‐                       ‐                       ‐                       ‐  0%
                     Maintenance & Replacment Funds                         ‐                       ‐                       ‐                       ‐                       ‐  0%
                Total Capital and M&R Projects                              ‐                85,000               85,000                       ‐              (85,000)  ‐100%

                     Transfers Out                                          ‐                       ‐                       ‐                       ‐                       ‐  0%
                     Other Sources                                          ‐                       ‐                       ‐                       ‐                       ‐  0%
                Total Other Uses                                            ‐                      ‐                          ‐                        ‐                        ‐  0%
                TOTAL NON‐OPERATING EXPENDITURES                            ‐                85,000               85,000                       ‐                (85,000)  ‐100%
                TOTAL EXPENDITURES & OTHER USES                             ‐                85,000               85,000                       ‐                (85,000)  ‐100%

              SUMMARY
                     Excess Revenues over(under) Expenditures              238,498              108,480         1,230,321              431,021            (799,300)  65%

                FUND BALANCE, BEGINNING                        1,413,345          1,651,843         1,651,843          2,882,164          1,230,321  74%
                FUND BALANCE, ENDING                           1,651,843          1,760,323         2,882,164          3,313,185              431,021  15%
                     Restricted/Assigned/Committed Funds          1,651,843          1,760,323         2,882,164          3,313,185              431,021  15%
                UNASSIGNED FUND BALANCE, ENDING        $                  ‐  $                  ‐  $                  ‐  $                  ‐  $                  ‐  0%
              RESTRICTED/ASSIGNED/COMMITED FUNDS
                     Cash            412 10110  00  000  $      1,651,843  $      1,760,323 $      2,882,164  $      3,313,185  $           431,021  15%


                TOTAL RESTRICTED/ASSIGNED/COMMITTED FUNDS  $      1,651,843  $      1,760,323 $      2,882,164  $      3,313,185  $         431,021  15%


                                                             328
   335   336   337   338   339   340   341   342   343   344   345