Page 332 - City of Westlake FY20 Budget
P. 332

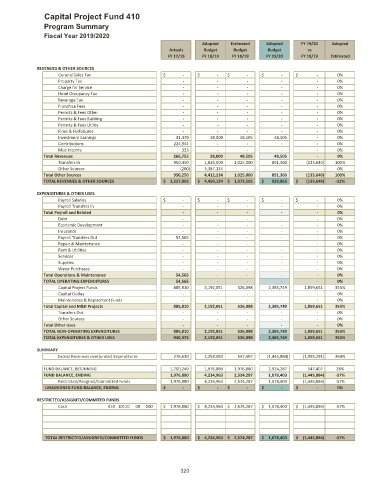
Capital Project Fund 410

                Program Summary
                Fiscal Year 2019/2020
                                                                    Adopted  Estimated   Adopted     FY 19/20  Adopted
                                                         Actuals    Budget    Budget      Budget       vs
                                                         FY 17/18   FY 18/19  FY 18/19   FY 19/20    FY 18/19  Estimated

             REVENUES & OTHER SOURCES
                    General Sales Tax                  $                  ‐    $                    ‐  $                  ‐    $                  ‐    $                    ‐  0%
                    Property Tax                                            ‐                       ‐                       ‐                       ‐                        ‐  0%
                    Charge for Service                                      ‐                       ‐                       ‐                       ‐                        ‐  0%
                    Hotel Occupancy Tax                                     ‐                       ‐                       ‐                       ‐                        ‐  0%
                    Beverage Tax                                            ‐                       ‐                       ‐                       ‐                        ‐  0%
                    Franchise Fees                                          ‐                       ‐                       ‐                       ‐                        ‐  0%
                    Permits & Fees Other                                    ‐                       ‐                       ‐                       ‐                        ‐  0%
                    Permits & Fees Building                                 ‐                       ‐                       ‐                       ‐                        ‐  0%
                    Permits & Fees Utility                                  ‐                       ‐                       ‐                       ‐                        ‐  0%
                    Fines & Forfeitures                                     ‐                       ‐                       ‐                       ‐                        ‐  0%
                    Investment Earnings                              41,479                38,000               48,505                48,505                        ‐  0%
                    Contributions                                  224,944                       ‐                       ‐                       ‐                        ‐  0%
                    Misc Income                                            333                       ‐                       ‐                       ‐                        ‐  0%
               Total Revenues                                      266,755                38,000               48,505                48,505                        ‐  0%
                    Transfers In                                   950,450          1,025,000         1,025,000              891,360              (133,640)  100%
                    Other Sources                                          (200)          3,387,134                      ‐                       ‐                        ‐  0%
               Total Other Sources                                 950,250          4,412,134         1,025,000              891,360              (133,640)  100%

               TOTAL REVENUES & OTHER SOURCES          $      1,217,005  $      4,450,134 $      1,073,505  $         939,865  $         (133,640)  ‐12%
             EXPENDITURES & OTHER USES
                    Payroll Salaries                   $                  ‐    $                    ‐  $                  ‐    $                  ‐    $                    ‐  0%
                    Payroll Transfers In                                    ‐                       ‐                       ‐                       ‐                        ‐  0%
               Total Payroll and Related                                    ‐                      ‐                        ‐                        ‐                          ‐  0%
                    Debt                                                    ‐                       ‐                       ‐                       ‐                        ‐  0%
                    Economic Development                                    ‐                       ‐                       ‐                       ‐                        ‐  0%
                    Insurance                                               ‐                       ‐                       ‐                       ‐                        ‐  0%
                    Payroll Transfers Out                            54,565                       ‐                       ‐                       ‐                        ‐  0%
                    Repair & Maintenance                                    ‐                       ‐                       ‐                       ‐                        ‐  0%
                    Rent & Utilities                                        ‐                       ‐                       ‐                       ‐                        ‐  0%
                    Services                                                ‐                       ‐                       ‐                       ‐                        ‐  0%
                    Supplies                                                ‐                       ‐                       ‐                       ‐                        ‐  0%
                    Water Purchases                                         ‐                       ‐                       ‐                       ‐                        ‐  0%
               Total Operations & Maintenance                        54,565                       ‐                      ‐                        ‐                          ‐  0%
               TOTAL OPERATING EXPENDITURES                          54,565                       ‐                      ‐                        ‐                          ‐  0%
                    Capital Project Funds                          885,810          2,192,051             526,098          2,385,749            1,859,651  353%
                    Capital Outlay                                          ‐                       ‐                       ‐                       ‐                        ‐  0%
                    Maintenance & Replacment Funds                          ‐                       ‐                       ‐                       ‐                        ‐  0%
               Total Capital and M&R Projects                      885,810          2,192,051             526,098          2,385,749            1,859,651  353%
                    Transfers Out                                           ‐                       ‐                       ‐                       ‐                        ‐  0%
                    Other Sources                                           ‐                       ‐                       ‐                       ‐                        ‐  0%
               Total Other Uses                                             ‐                      ‐                          ‐                      ‐                          ‐  0%
               TOTAL NON‐OPERATING EXPENDITURES                    885,810          2,192,051             526,098          2,385,749            1,859,651  353%
               TOTAL EXPENDITURES & OTHER USES                     940,375          2,192,051             526,098          2,385,749            1,859,651  353%

             SUMMARY
                    Excess Revenues over(under) Expenditures              276,630          2,258,083             547,407         (1,445,884)           (1,993,291)  364%
               FUND BALANCE, BEGINNING                         1,700,249          1,976,880         1,976,880          2,524,287               547,407  28%
               FUND BALANCE, ENDING                            1,976,880          4,234,963         2,524,287          1,078,403          (1,445,884)  ‐57%
                    Restricted/Assigned/Committed Funds          1,976,880          4,234,963         2,524,287          1,078,403           (1,445,884)  ‐57%
                UNASSIGNED FUND BALANCE, ENDING        $                  ‐  $                  ‐  $                  ‐  $                  ‐  $                    ‐  0%
             RESTRICTED/ASSIGNED/COMMITED FUNDS
                    Cash             410 10110  00  000  $      1,976,880  $      4,234,963 $      2,524,287  $      1,078,403  $      (1,445,884)  ‐57%


                TOTAL RESTRICTED/ASSIGNED/COMMITTED FUNDS  $      1,976,880  $      4,234,963 $      2,524,287  $      1,078,403  $      (1,445,884)  ‐57%


                                                             320
   327   328   329   330   331   332   333   334   335   336   337