Page 308 - City of Westlake FY20 Budget
P. 308

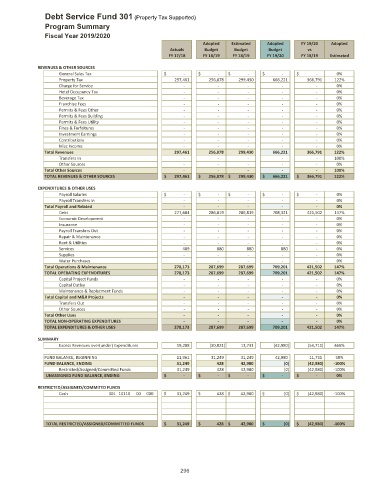
Debt Service Fund 301 (Property Tax Supported)
                Program Summary
                Fiscal Year 2019/2020
                                                                    Adopted   Estimated  Adopted     FY 19/20  Adopted
                                                         Actuals     Budget    Budget     Budget       vs
                                                         FY 17/18   FY 18/19  FY 18/19   FY 19/20    FY 18/19  Estimated

              REVENUES & OTHER SOURCES
                     General Sales Tax                 $                   ‐  $                   ‐  $                   ‐  $                   ‐  $                   ‐  0%
                     Property Tax                                  297,461              256,878             299,430              666,221              366,791  122%
                     Charge for Service                                     ‐                       ‐                       ‐                       ‐                       ‐  0%
                     Hotel Occupancy Tax                                    ‐                       ‐                       ‐                       ‐                       ‐  0%
                     Beverage Tax                                           ‐                       ‐                       ‐                       ‐                       ‐  0%
                     Franchise Fees                                         ‐                       ‐                       ‐                       ‐                       ‐  0%
                     Permits & Fees Other                                   ‐                       ‐                       ‐                       ‐                       ‐  0%
                     Permits & Fees Building                                ‐                       ‐                       ‐                       ‐                       ‐  0%
                     Permits & Fees Utility                                 ‐                       ‐                       ‐                       ‐                       ‐  0%
                     Fines & Forfeitures                                    ‐                       ‐                       ‐                       ‐                       ‐  0%
                     Investment Earnings                                    ‐                       ‐                       ‐                       ‐                       ‐  0%
                     Contributions                                          ‐                       ‐                       ‐                       ‐                       ‐  0%
                     Misc Income                                            ‐                       ‐                       ‐                       ‐                       ‐  0%
                Total Revenues                                     297,461              256,878             299,430              666,221              366,791  122%
                     Transfers In                                           ‐                       ‐                       ‐                       ‐                       ‐  100%
                     Other Sources                                          ‐                       ‐                       ‐                       ‐                       ‐  0%
                Total Other Sources                                         ‐                       ‐                       ‐                       ‐                       ‐  100%
                TOTAL REVENUES & OTHER SOURCES         $         297,461  $         256,878 $         299,430  $         666,221  $         366,791  122%
              EXPENDITURES & OTHER USES
                     Payroll Salaries                  $                   ‐  $                   ‐  $                   ‐  $                   ‐  $                   ‐  0%
                     Payroll Transfers In                                   ‐                       ‐                       ‐                       ‐                       ‐  0%
                Total Payroll and Related                                   ‐                       ‐                       ‐                       ‐                       ‐  0%
                     Debt                                          277,684              286,819             286,819              708,321              421,502  147%
                     Economic Development                                   ‐                       ‐                       ‐                       ‐                       ‐  0%
                     Insurance                                              ‐                       ‐                       ‐                       ‐                       ‐  0%
                     Payroll Transfers Out                                  ‐                       ‐                       ‐                       ‐                       ‐  0%
                     Repair & Maintenance                                   ‐                       ‐                       ‐                       ‐                       ‐  0%
                     Rent & Utilities                                       ‐                       ‐                       ‐                       ‐                       ‐  0%
                     Services                                              489                      880                     880                      880                       ‐  0%
                     Supplies                                               ‐                       ‐                       ‐                       ‐                       ‐  0%
                     Water Purchases                                        ‐                       ‐                       ‐                       ‐                       ‐  0%
                Total Operations & Maintenance                     278,173              287,699             287,699              709,201              421,502  147%
                TOTAL OPERATING EXPENDITURES                       278,173              287,699             287,699              709,201              421,502  147%
                     Capital Project Funds                                  ‐                       ‐                       ‐                       ‐                       ‐  0%
                     Capital Outlay                                         ‐                       ‐                       ‐                       ‐                       ‐  0%
                     Maintenance & Replacment Funds                         ‐                       ‐                       ‐                       ‐                       ‐  0%
                Total Capital and M&R Projects                              ‐                       ‐                       ‐                       ‐                       ‐  0%
                     Transfers Out                                          ‐                       ‐                       ‐                       ‐                       ‐  0%
                     Other Sources                                          ‐                       ‐                       ‐                       ‐                       ‐  0%
                Total Other Uses                                            ‐                       ‐                       ‐                       ‐                       ‐  0%
                TOTAL NON‐OPERATING EXPENDITURES                            ‐                       ‐                       ‐                       ‐                       ‐  0%
                TOTAL EXPENDITURES & OTHER USES                    278,173              287,699             287,699              709,201              421,502  147%

              SUMMARY
                     Excess Revenues over(under) Expenditures                19,288               (30,821)               11,731               (42,980)               (54,711)  466%
                FUND BALANCE, BEGINNING                              11,961                31,249               31,249                42,980                11,731  38%
                FUND BALANCE, ENDING                                 31,249                      428               42,980                         (0)               (42,980)  ‐100%
                     Restricted/Assigned/Committed Funds                31,249                      428               42,980                         (0)               (42,980)  ‐100%
                UNASSIGNED FUND BALANCE, ENDING        $                  ‐  $                  ‐  $                  ‐  $                  ‐  $                  ‐  0%

              RESTRICTED/ASSIGNED/COMMITED FUNDS
                     Cash            301 10110  00  000  $            31,249  $                  428 $            42,980  $                     (0)  $           (42,980)  ‐100%


                TOTAL RESTRICTED/ASSIGNED/COMMITTED FUNDS  $            31,249  $                 428 $            42,980  $                     (0)  $          (42,980)  ‐100%


                                                             296
   303   304   305   306   307   308   309   310   311   312   313