Page 276 - City of Westlake FY20 Budget
P. 276

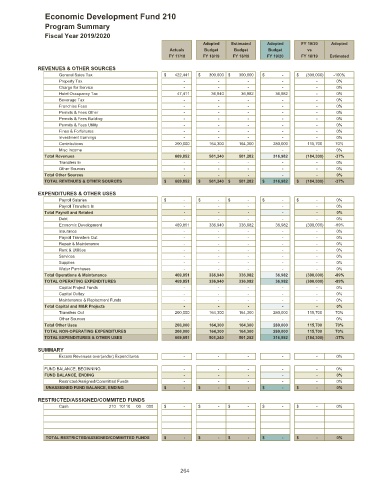
Economic Development Fund 210

                Program Summary
                Fiscal Year 2019/2020
                                                                    Adopted   Estimated  Adopted     FY 19/20  Adopted
                                                         Actuals     Budget   Budget      Budget       vs
                                                         FY 17/18   FY 18/19  FY 18/19   FY 19/20    FY 18/19  Estimated

              REVENUES & OTHER SOURCES
                     General Sales Tax                 $         422,441  $         300,000  $         300,000  $                 -  $        (300,000)  -100%
                     Property Tax                                         -                     -                     -                     -                     -  0%
                     Charge for Service                                   -                     -                     -                     -                     -  0%
                     Hotel Occupancy Tax                            47,411               36,940               36,982               36,982                     -  0%
                     Beverage Tax                                         -                     -                     -                     -                     -  0%
                     Franchise Fees                                       -                     -                     -                     -                     -  0%
                     Permits & Fees Other                                 -                     -                     -                     -                     -  0%
                     Permits & Fees Building                              -                     -                     -                     -                     -  0%
                     Permits & Fees Utility                               -                     -                     -                     -                     -  0%
                     Fines & Forfeitures                                  -                     -                     -                     -                     -  0%
                     Investment Earnings                                  -                     -                     -                     -                     -  0%
                     Contributions                                200,000             164,300             164,300             280,000             115,700  70%
                     Misc Income                                          -                     -                     -                     -                     -  0%
                Total Revenues                                    669,852             501,240             501,282             316,982            (184,300)  -37%
                     Transfers In                                         -                     -                     -                     -                     -  0%
                     Other Sources                                        -                     -                     -                     -                     -  0%
                Total Other Sources                                       -                     -                     -                     -                     -  0%
                TOTAL REVENUES & OTHER SOURCES         $         669,852  $         501,240  $         501,282  $         316,982  $        (184,300)  -37%
              EXPENDITURES & OTHER USES
                     Payroll Salaries                  $                 -  $                 -  $                 -  $                 -  $                 -  0%
                     Payroll Transfers In                                 -                     -                     -                     -                     -  0%
                Total Payroll and Related                                 -                     -                     -                     -                     -  0%
                     Debt                                                 -                     -                     -                     -                     -  0%
                     Economic Development                         469,851             336,940             336,982               36,982            (300,000)  -89%
                     Insurance                                            -                     -                     -                     -                     -  0%
                     Payroll Transfers Out                                -                     -                     -                     -                     -  0%
                     Repair & Maintenance                                 -                     -                     -                     -                     -  0%
                     Rent & Utilities                                     -                     -                     -                     -                     -  0%
                     Services                                             -                     -                     -                     -                     -  0%
                     Supplies                                             -                     -                     -                     -                     -  0%
                     Water Purchases                                      -                     -                     -                     -                     -  0%
                Total Operations & Maintenance                    469,851             336,940             336,982               36,982            (300,000)  -89%
                TOTAL OPERATING EXPENDITURES                      469,851             336,940             336,982               36,982            (300,000)  -89%
                     Capital Project Funds                                -                     -                     -                     -                     -  0%
                     Capital Outlay                                       -                     -                     -                     -                     -  0%
                     Maintenance & Replacment Funds                       -                     -                     -                     -                     -  0%
                Total Capital and M&R Projects                            -                     -                     -                     -                     -  0%
                     Transfers Out                                200,000             164,300             164,300             280,000             115,700  70%
                     Other Sources                                        -                     -                     -                     -                     -  0%
                Total Other Uses                                  200,000             164,300             164,300             280,000             115,700  70%
                TOTAL NON-OPERATING EXPENDITURES                  200,000             164,300             164,300             280,000             115,700  70%
                TOTAL EXPENDITURES & OTHER USES                   669,851             501,240             501,282             316,982            (184,300)  -37%

              SUMMARY
                     Excess Revenues over(under) Expenditures                     -                     -                     -                     -                     -  0%

                FUND BALANCE, BEGINNING                                   -                     -                     -                     -                     -  0%
                FUND BALANCE, ENDING                                      -                     -                     -                     -                     -  0%
                     Restricted/Assigned/Committed Funds                     -                     -                     -                     -                     -  0%
                UNASSIGNED FUND BALANCE, ENDING        $                 -  $                 -  $                 -  $                 -  $                 -  0%
              RESTRICTED/ASSIGNED/COMMITED FUNDS
                     Cash            210 10110  00  000  $                 -  $                 -  $                 -  $                 -  $                 -  0%


                TOTAL RESTRICTED/ASSIGNED/COMMITTED FUNDS  $                 -  $                 -  $                 -  $                 -  $                 -  0%


                                                             264
   271   272   273   274   275   276   277   278   279   280   281