
Page 237 - City of Westlake FY20 Budget
P. 237
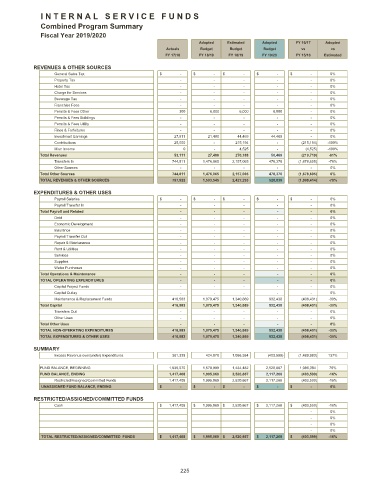
I N T E R N A L S E R V I C E F U N D S
Combined Program Summary
Fiscal Year 2019/2020
Adopted Estimated Adopted FY 16/17 Adopted
Actuals Budget Budget Budget vs vs
FY 17/18 FY 18/19 FY 18/19 FY 19/20 FY 15/16 Estimated
REVENUES & OTHER SOURCES
1 General Sales Tax $ - $ - $ - $ - $ - 0%
2 Property Tax - - - - - 0%
3 Hotel Tax - - - - - 0%
4 Charge for Services - - - - - 0%
5 Beverage Tax - - - - - 0%
6 Franchise Fees - - - - - 0%
7 Permits & Fees Other 300 6,000 6,000 6,000 - 0%
8 Permits & Fees Buildings - - - - - 0%
9 Permits & Fees Utility - - - - - 0%
9 Fines & Forfeitures - - - - - 0%
10 Investment Earnings 27,811 21,480 44,469 44,469 - 0%
11 Contributions 25,000 - 215,194 - (215,194) -100%
12 Misc Income 0 - 4,525 - (4,525) -100%
13 Total Revenues 53,111 27,480 270,188 50,469 (219,719) -81%
14 Transfers In 744,811 1,476,065 2,157,065 478,370 (1,678,695) -78%
15 Other Sources - - - - - 0%
16 Total Other Sources 744,811 1,476,065 2,157,065 478,370 (1,678,695) 0%
17 TOTAL REVENUES & OTHER SOURCES 797,922 1,503,545 2,427,253 528,839 (1,898,414) -78%
EXPENDITURES & OTHER USES
18 Payroll Salaries $ - $ - $ - $ - $ - 0%
19 Payroll Transfer In - - - - - 0%
20 Total Payroll and Related - - - - - 0%
21 Debt - - - - - 0%
22 Economic Development - - - - - 0%
23 Insurance - - - - - 0%
24 Payroll Transfer Out - - - - - 0%
24 Repair & Maintenance - - - - - 0%
25 Rent & Utilities - - - - - 0%
26 Services - - - - - 0%
27 Supplies - - - - - 0%
28 Water Purchases - - - - - 0%
29 Total Operations & Maintenance - - - - - 0%
30 TOTAL OPERATING EXPENDITURES - - - - - 0%
31 Capital Project Funds - - - - - 0%
32 Capital Outlay - - - - - 0%
33 Maintenance & Replacement Funds 416,583 1,079,475 1,340,869 932,438 (408,431) -30%
34 Total Capital 416,583 1,079,475 1,340,869 932,438 (408,431) -30%
35 Transfers Out - - - - - 0%
36 Other Uses - - - - - 0%
37 Total Other Uses - - - - - 0%
38 TOTAL NON-OPERATING EXPENDITURES 416,583 1,079,475 1,340,869 932,438 (408,431) -30%
39 TOTAL EXPENDITURES & OTHER USES 416,583 1,079,475 1,340,869 932,438 (408,431) -30%
SUMMARY
40 Excess Revenus over(under) Expenditures 381,339 424,070 1,086,384 (403,599) (1,489,983) 137%
41 FUND BALANCE, BEGINNING 1,036,070 1,570,999 1,434,482 2,520,867 1,086,384 76%
42 FUND BALANCE, ENDING 1,417,408 1,995,069 2,520,867 2,117,268 (403,599) -16%
43 Restricted/Assigned/Committed Funds 1,417,408 1,995,069 2,520,867 2,117,268 (403,599) -16%
44 UNASSIGNED FUND BALANCE, ENDING $ - $ - $ - $ - $ - 0%
RESTRICTED/ASSIGNED/COMMITTED FUNDS
45 Cash $ 1,417,408 $ 1,995,069 $ 2,520,867 $ 2,117,268 $ (403,599) -16%
46 - 0%
47 - 0%
48 - 0%
49 - 0%
50 TOTAL RESTRICTED/ASSIGNED/COMMITTED FUNDS $ 1,417,408 $ 1,995,069 $ 2,520,867 $ 2,117,268 $ (403,599) -16%
225