
Page 149 - City of Westlake FY20 Budget
P. 149
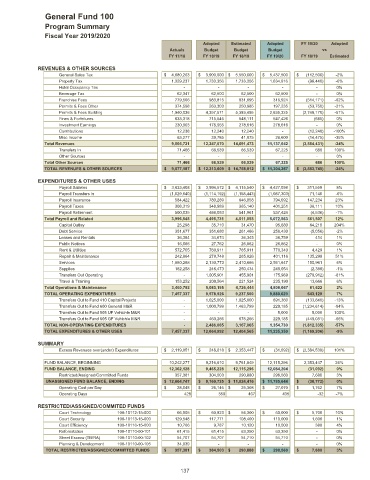
General Fund 100
Program Summary
Fiscal Year 2019/2020
Adopted Estimated Adopted FY 19/20 Adopted
Actuals Budget Budget Budget vs
FY 17/18 FY 18/19 FY 18/19 FY 19/20 FY 18/19 Estimated
REVENUES & OTHER SOURCES
General Sales Tax $ 4,080,263 $ 3,900,000 $ 5,550,000 $ 5,437,500 $ (112,500) -2%
Property Tax 1,329,237 1,733,356 1,733,356 1,634,916 (98,440) -6%
Hotel Occupancy Tax - - - - - 0%
Beverage Tax 62,347 62,500 62,500 62,500 - 0%
Franchise Fees 779,506 983,815 831,095 316,924 (514,171) -62%
Permits & Fees Other 374,598 263,303 250,985 197,235 (53,750) -21%
Permits & Fees Building 1,940,036 4,357,571 5,383,495 2,635,325 (2,748,170) -51%
Fines & Forfeitures 633,318 715,545 548,111 547,426 (685) 0%
Investment Earnings 230,903 178,955 278,616 278,616 - 0%
Contributions 12,238 12,240 12,240 - (12,240) -100%
Misc Income 63,277 39,785 41,075 26,600 (14,475) -35%
Total Revenues 9,505,721 12,247,070 14,691,473 11,137,042 (3,554,431) -24%
Transfers In 71,466 66,539 66,539 67,225 686 100%
Other Sources - - - - - 0%
Total Other Sources 71,466 66,539 66,539 67,225 686 100%
TOTAL REVENUES & OTHER SOURCES $ 9,577,187 $ 12,313,609 $ 14,758,012 $ 11,204,267 $ (3,553,745) -24%
EXPENDITURES & OTHER USES
Payroll Salaries $ 3,633,408 $ 3,994,572 $ 4,115,540 $ 4,427,098 $ 311,559 8%
Payroll Transfers In (1,029,640) (1,114,192) (1,158,443) (1,087,303) 71,140 -6%
Payroll Insurance 584,422 780,269 646,858 794,092 147,234 23%
Payroll Taxes 308,319 348,989 365,140 401,251 36,111 10%
Payroll Retirement 500,035 486,093 541,961 537,424 (4,536) -1%
Total Payroll and Related 3,996,545 4,495,731 4,511,055 5,072,563 561,507 12%
Capital Outlay 25,298 35,710 31,470 95,680 64,210 204%
Debt Service 351,677 351,680 261,486 256,430 (5,056) -2%
Leases and Rentals 36,384 34,674 36,345 36,759 414 1%
Public Notices 16,066 27,762 26,862 26,862 - 0%
Rent & Utilities 572,705 760,911 765,911 770,340 4,429 1%
Repair & Maintenance 242,864 279,748 265,826 401,116 135,290 51%
Services 1,880,288 2,130,773 2,410,686 2,561,647 150,961 6%
Supplies 182,258 246,473 250,434 248,054 (2,380) -1%
Transfers Out Operating - 1,005,901 455,901 175,989 (279,912) -61%
Travel & Training 153,252 209,564 221,524 235,190 13,666 6%
Total Operations & Maintenance 3,460,792 5,083,195 4,726,444 4,808,067 81,622 2%
TOTAL OPERATING EXPENDITURES 7,457,337 9,578,926 9,237,500 9,880,629 643,129 7%
Transfers Out to Fund 410 Capital Projects - 1,025,000 1,025,000 891,360 (133,640) -13%
Transfers Out to Fund 600 General M&R - 1,000,799 1,463,799 229,185 (1,234,614) -84%
Transfers Out to Fund 505 UF Vehichle M&R - - - 5,000 5,000 100%
Transfers Out to Fund 605 GF Vehichle M&R - 460,266 678,266 229,185 (449,081) -66%
TOTAL NON-OPERATING EXPENDITURES - 2,486,065 3,167,065 1,354,730 (1,812,335) -57%
TOTAL EXPENDITURES & OTHER USES 7,457,337 12,064,992 12,404,565 11,235,359 (1,169,206) -9%
SUMMARY
Excess Revenues over(under) Expenditures $ 2,119,851 $ 248,618 $ 2,353,447 $ (31,092) $ (2,384,539) 101%
FUND BALANCE, BEGINNING 10,242,277 9,216,610 9,761,849 12,115,296 2,353,447 24%
FUND BALANCE, ENDING 12,362,128 9,465,228 12,115,296 12,084,204 (31,092) 0%
Restricted/Assigned/Committed Funds 357,381 304,503 290,880 298,560 7,680 3%
UNASSIGNED FUND BALANCE, ENDING $ 12,004,747 $ 9,160,725 $ 11,824,416 $ 11,785,644 $ (38,772) 0%
Operating Cost per Day $ 28,048 $ 26,146 $ 25,308 $ 27,070 $ 1,762 7%
Operating Days 428 350 467 435 -32 -7%
RESTRICTED/ASSIGNED/COMMITED FUNDS
Court Technology 100-10112-15-000 66,905 $ 60,823 $ 54,300 $ 60,000 $ 5,700 10%
Court Security 100-10113-15-000 129,548 117,771 108,400 110,000 1,600 1%
Court Efficiency 100-10116-15-000 10,766 9,787 10,120 10,500 380 4%
Reforestation 100-10110-00-101 61,415 61,415 63,350 63,350 - 0%
Street Escrow (TB/RA) 100-10110-00-102 54,707 54,707 54,710 54,710 - 0%
Planning & Development 100-10110-00-105 34,039 - - - - 0%
TOTAL RESTRICTED/ASSIGNED/COMMITTED FUNDS $ 357,381 $ 304,503 $ 290,880 $ 298,560 $ 7,680 3%
137