Page 299 - Southlake FY20 Budget
P. 299

Debt Service Funds Expenditures


        Debt Management

        The City takes it debt obligation very seriously.   Several years ago, the City Council working with City staff set goals to
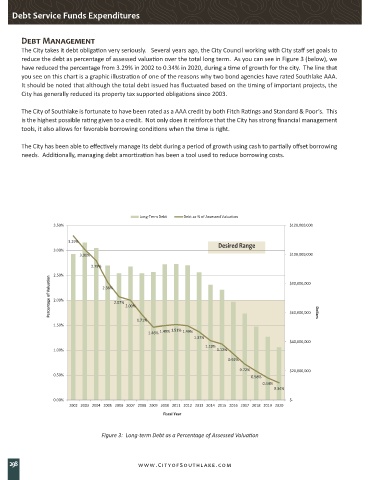
        reduce the debt as percentage of assessed valuation over the total long term.  As you can see in Figure 3 (below), we
        have reduced the percentage from 3.29% in 2002 to 0.34% in 2020, during a time of growth for the city.  The line that
        you see on this chart is a graphic illustration of one of the reasons why two bond agencies have rated Southlake AAA.
        It should be noted that although the total debt issued has fluctuated based on the timing of important projects, the
        City has generally reduced its property tax supported obligations since 2003.


        The City of Southlake is fortunate to have been rated as a AAA credit by both Fitch Ratings and Standard & Poor’s.  This
        is the highest possible rating given to a credit.  Not only does it reinforce that the City has strong financial management
        tools, it also allows for favorable borrowing conditions when the time is right.

        The City has been able to effectively manage its debt during a period of growth using cash to partially offset borrowing
        needs.  Additionally, managing debt amortization has been a tool used to reduce borrowing costs.


                                               Long-Term Debt  Debt as % of Assessed Valuation
                   3.50%                                                                          $120,000,000

                        3.29%
                                                                         Desired Range
                   3.00%
                           3.01%                                                                  $100,000,000
                               2.79%
                   2.50%                                                                          $80,000,000
                 Percentage of Valuation  2.00%  2.36%  2.07%  2.00%


                                              1.71%                                               $60,000,000  Dollars
                   1.50%
                                                      1.49% 1.51%
                                                  1.46%      1.49%
                                                                 1.37%
                                                                                                  $40,000,000
                                                                     1.19%
                   1.00%                                                 1.12%
                                                                             0.92%
                                                                                0.72%             $20,000,000
                   0.50%                                                            0.58%
                                                                                        0.44%
                                                                                            0.34%
                   0.00%                                                                          $-
                        2002 2003 2004 2005 2006 2007 2008 2009 2010 2011 2012 2013 2014 2015 2016 2017 2018 2019 2020
                                                       Fiscal Year


                                   Figure 3:  Long-term Debt as a Percentage of Assessed Valuation


    298                                        www.CityofSouthlake.com
   294   295   296   297   298   299   300   301   302   303   304