
Page 75 - Keller FY20 Approved Budget
P. 75
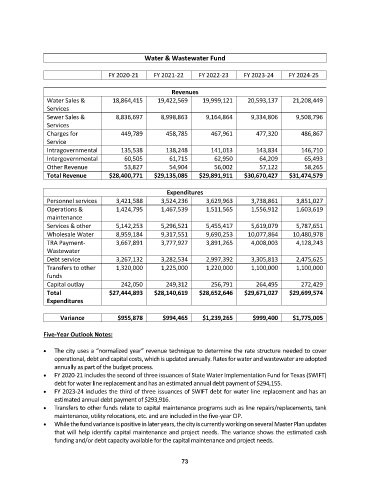
Water & Wastewater Fund
FY 2020-21 FY 2021-22 FY 2022-23 FY 2023-24 FY 2024-25
Revenues
Water Sales & 18,864,415 19,422,569 19,999,121 20,593,137 21,208,449
Services
Sewer Sales & 8,836,697 8,998,863 9,164,864 9,334,806 9,508,796
Services
Charges for 449,789 458,785 467,961 477,320 486,867
Service
Intragovernmental 135,538 138,248 141,013 143,834 146,710
Intergovernmental 60,505 61,715 62,950 64,209 65,493
Other Revenue 53,827 54,904 56,002 57,122 58,265
Total Revenue $28,400,771 $29,135,085 $29,891,911 $30,670,427 $31,474,579
Expenditures
Personnel services 3,421,588 3,524,236 3,629,963 3,738,861 3,851,027
Operations & 1,424,795 1,467,539 1,511,565 1,556,912 1,603,619
maintenance
Services & other 5,142,253 5,296,521 5,455,417 5,619,079 5,787,651
Wholesale Water 8,959,184 9,317,551 9,690,253 10,077,864 10,480,978
TRA Payment- 3,667,891 3,777,927 3,891,265 4,008,003 4,128,243
Wastewater
Debt service 3,267,132 3,282,534 2,997,392 3,305,813 2,475,625
Transfers to other 1,320,000 1,225,000 1,220,000 1,100,000 1,100,000
funds
Capital outlay 242,050 249,312 256,791 264,495 272,429
Total $27,444,893 $28,140,619 $28,652,646 $29,671,027 $29,699,574
Expenditures
Variance $955,878 $994,465 $1,239,265 $999,400 $1,775,005
Five-Year Outlook Notes:
The city uses a “normalized year” revenue technique to determine the rate structure needed to cover
operational, debt and capital costs, which is updated annually. Rates for water and wastewater are adopted
annually as part of the budget process.
FY 2020-21 includes the second of three issuances of State Water Implementation Fund for Texas (SWIFT)
debt for water line replacement and has an estimated annual debt payment of $294,155.
FY 2023-24 includes the third of three issuances of SWIFT debt for water line replacement and has an
estimated annual debt payment of $293,916.
Transfers to other funds relate to capital maintenance programs such as line repairs/replacements, tank
maintenance, utility relocations, etc. and are included in the five-year CIP.
While the fund variance is positive in later years, the city is currently working on several Master Plan updates
that will help identify capital maintenance and project needs. The variance shows the estimated cash
funding and/or debt capacity available for the capital maintenance and project needs.
73